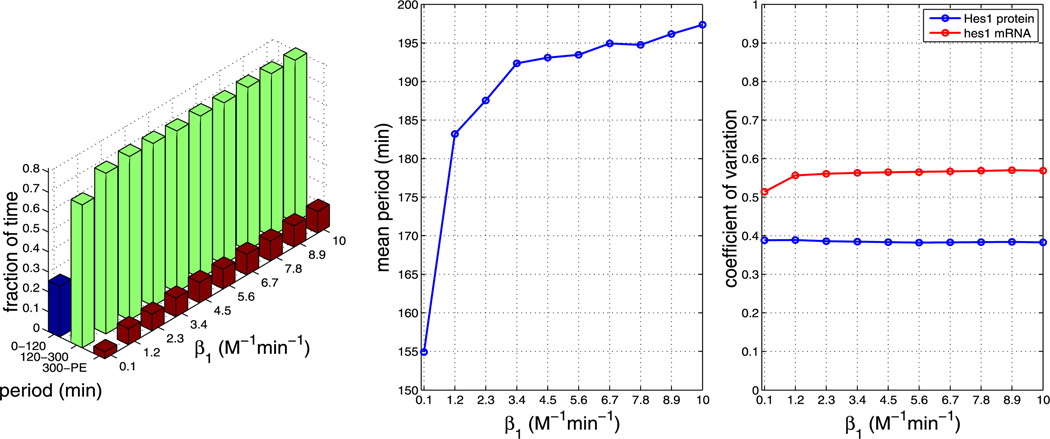
Fig. 21.
Plots showing the effect of varying parameter β1 (all other parameters as per Table 1). The left plot shows the fraction of time the system spends oscillating with a period in the range 0–120 minutes, 120–300 minutes and 300–PE as β1 is varied. The middle plot shows how the mean period varies as β1 is varied. The right plot shows how the CV varies for mRNA and protein as β1 is varied. As can be seen from the plots, varying β1 has a large impact on the mean period. The plots show that increasing β1 increases the mean period (Color figure online)

