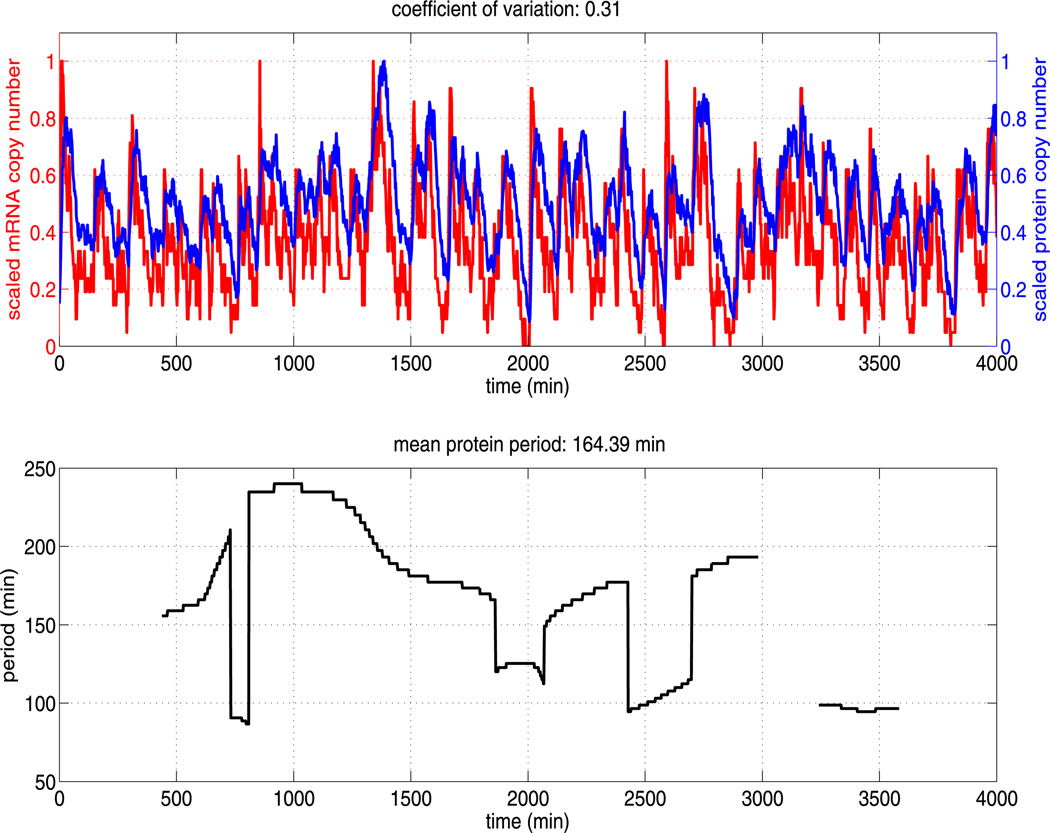
Fig. 4.
The upper plot shows the (scaled) total copy number of mRNA and protein (monomer and dimer) for a single trajectory of the Hes1 model (see Table 1 for parameter values). The mRNA and protein oscillations have approximately the same scaled amplitude and highly variable period. The lower plot shows the corresponding time varying period of Hes1 protein as estimated by the continuous time wavelet transform (as implemented in WAVOS). As can be seen, the period is highly variable over time and an accurate estimate of the mean period requires long sampling times

