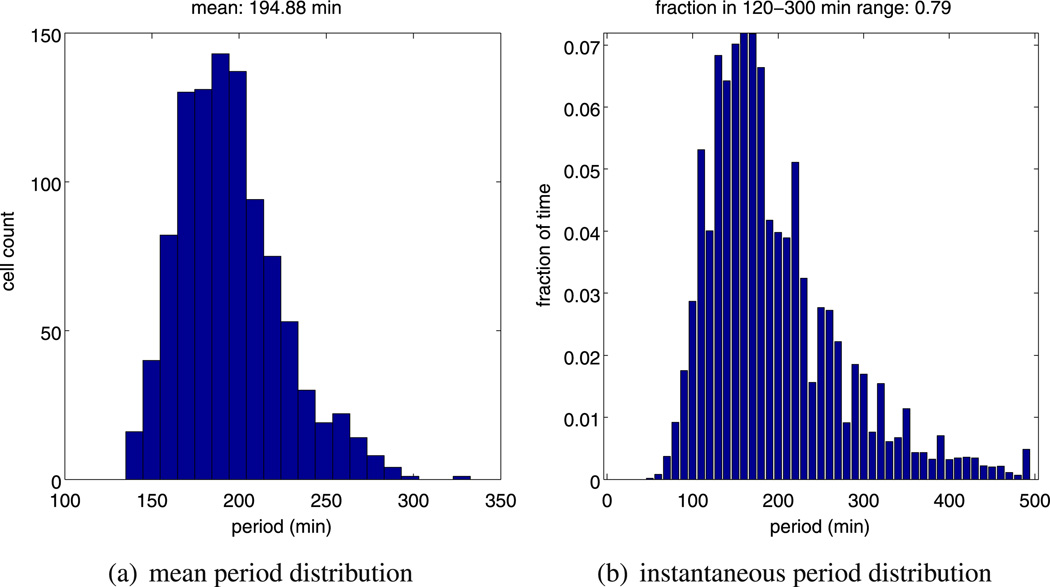
Fig. 5.
Plots showing, (a) a histogram of the mean period distribution, and, (b) a histogram of the instantaneous period distribution for Hes1 protein numbers. These histograms were generated from ensembles of 1000 independent realisations of model A using the same parameters (as stated in Table 1)

