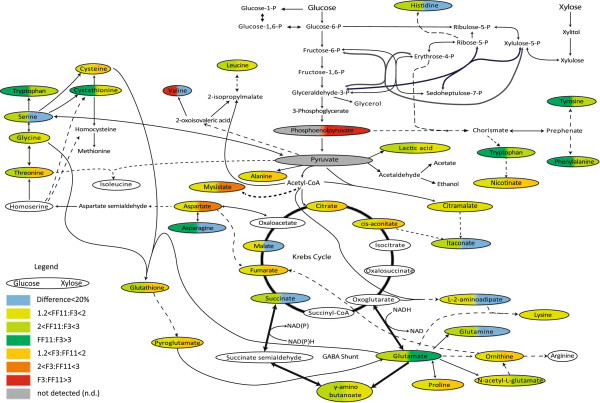
Figure 1.
Schematic demonstration of the relative intracellular concentrations of amino and non-amino organic acids during aerobic growth of F. oxysporum F3 and FF11 strains on glucose and xylose. Single lines: One enzyme reaction; dashed lines: several reactions; Colours on the left and right correspond to the difference with glucose and xylose, respectively, as substrate. Red: F3:FF11 > 3; Orange: 2 < F3:FF11 < 3; yellow: 1.2 < F3:FF11 < 2: Dark green: FF11:F3 > 3; Green: 2 < FF11:F3 < 3; Light green: 1.2 < FF11:F3 < 2: blue: difference smaller than 20%; grey: not detected.

