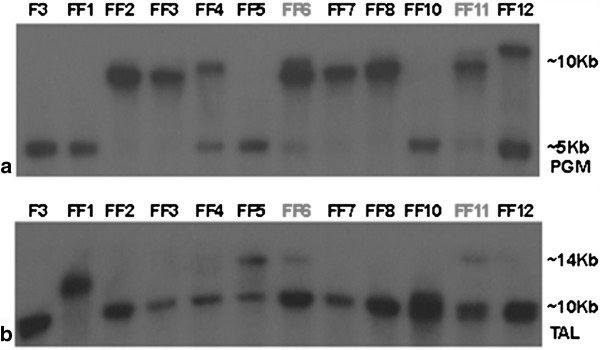
Figure 3.

Southern blot analysis of the eleven transformed strains, in comparison to the wild type strains (F3), using (a) pgm and (b) tal as probe. The bands at 5 Kbp for phosphoglucomutase and 10 Kbp for transaldolase correspond to the native gene DNA fragment after fractionation of the genomic DNA with XhoI. The larger bands correspond to the whole plasmid being incorporated in the genome in the same (10 Kbp and 14 Kbp respectively) or different positions.
