Figure 4.

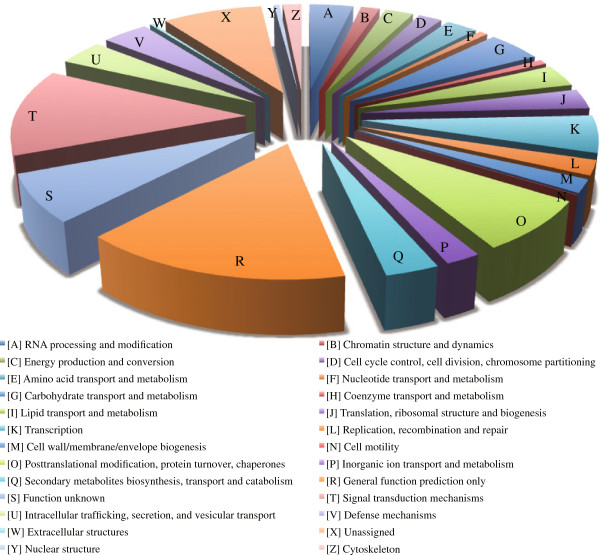
Functional classification and relative levels of ESTs derived from cambium region of C. japonica. Values are shown as percentage of unique transcripts in the pool.

Functional classification and relative levels of ESTs derived from cambium region of C. japonica. Values are shown as percentage of unique transcripts in the pool.