
FIGURE 7.
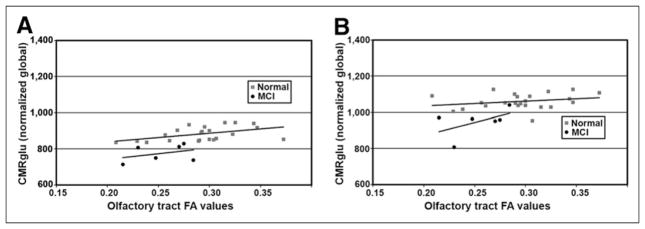
Scatterplots comparing OT integrity to glucose metabolism in anterior and posterior cingulate cortices. (A) Trend lines indicate nearly parallel association for both groups in anterior cingulate. (B) However, in posterior cingulate cortex association was correlated differentially, possibly reflecting underlying disease processes.