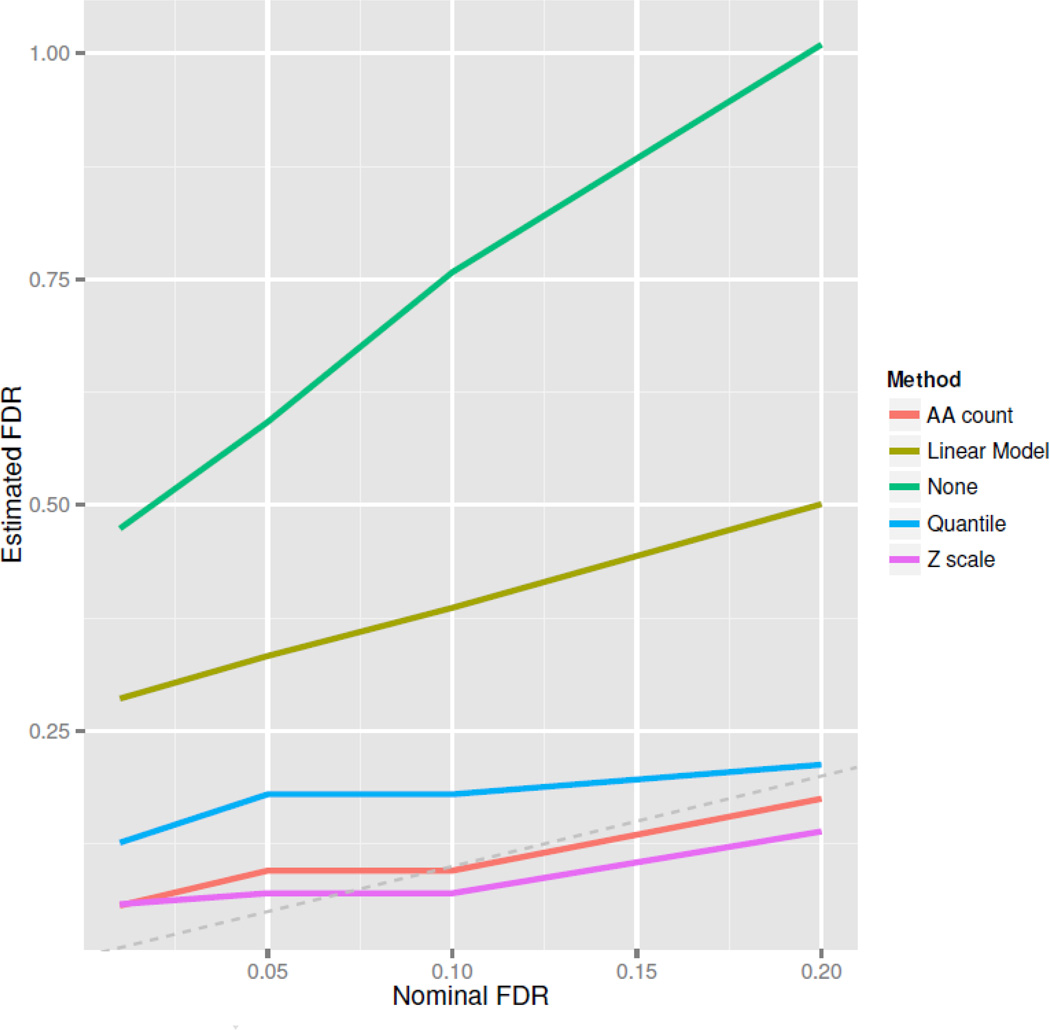
Figure 5. FDR Estimation.
We use placebo data in RV144a to estimate the false discovery proportion (FDP) for thresholds generated by our FDR method. Curves represent the estimated FDP at various nominal false discovery rate (FDR) levels. The FDP is a random quantity, but should usually be close to the FDR. The amino acid count-model and the Z-scale model show good FDR control.

