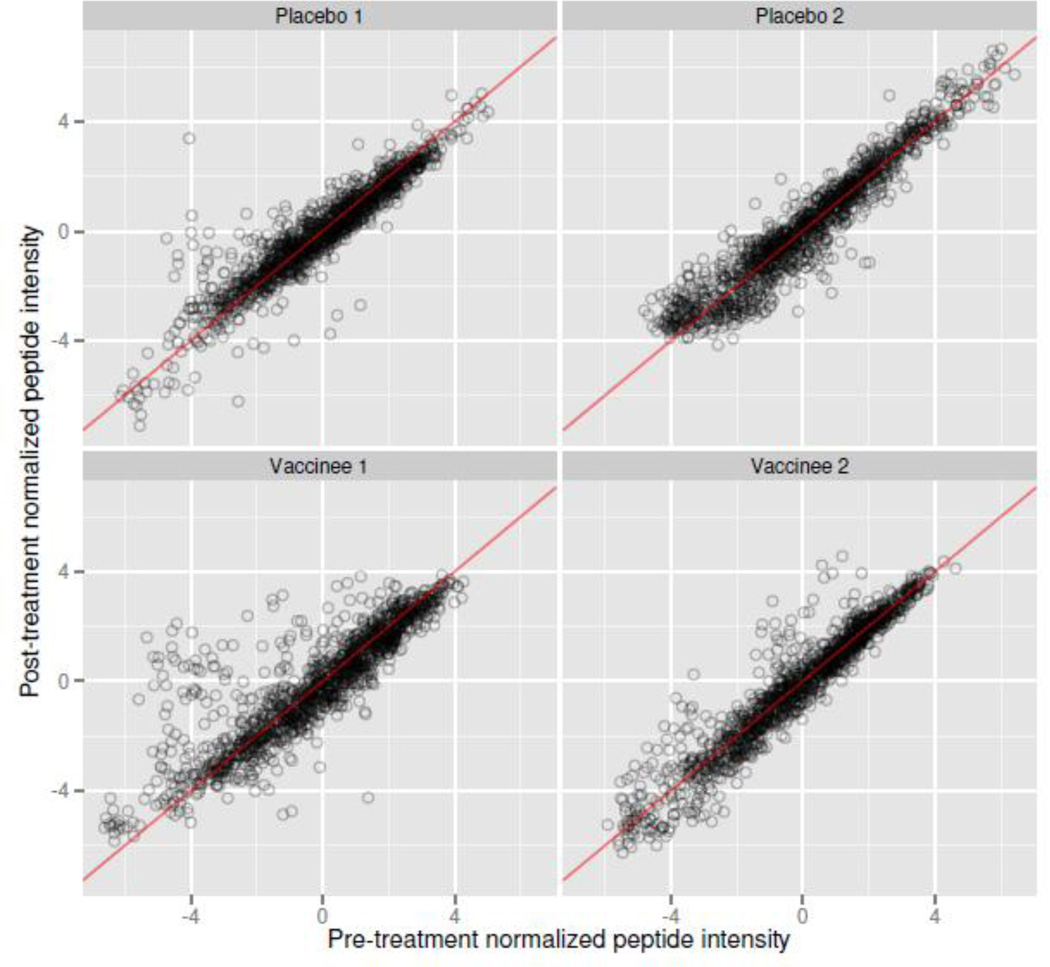
Figure 7. Baseline Correlation.
Scatterplots of pre versus post-treatment Z-scale normalized peptide intensity values, from randomly sampled placebo and vaccinated subjects. The red line is the identity line. Unbound peptides correlate very strongly between samples within subject, demonstrating that subject-specific controls can dramatically reduce response variability. Points well above the line y = x in vaccinated subjects likely correspond to bound peptides.

