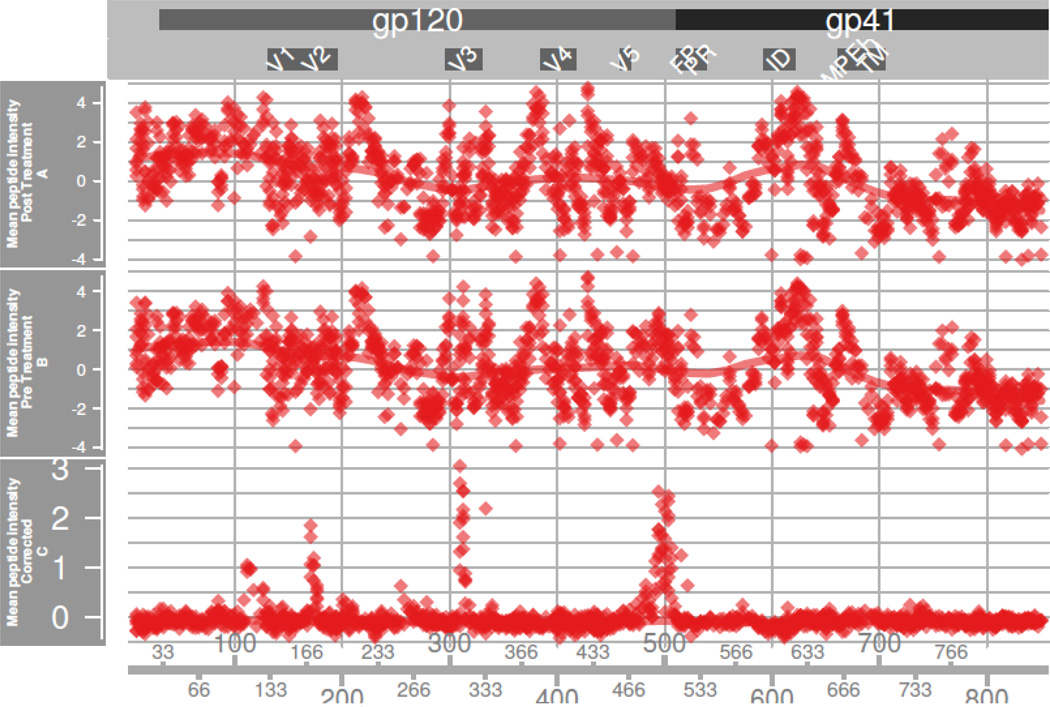
Figure 8. Baseline Correction.
In RV144a, we plot three tracks of across-subject Z-scale normalized peptide intensity means as a function of their HxB2 position: means of peptides in pre-treatment samples, means of peptides in post-treatment samples, and the mean of the differences. A smoother line tracks overall trends. By visual inspection one sees that the pre and post-treatment tracks are highly similar. The differences are tightly centered around zero, except at positions experiencing a vaccine response. This indicates the presence of weak nonspecific effects that normalization cannot remove.

