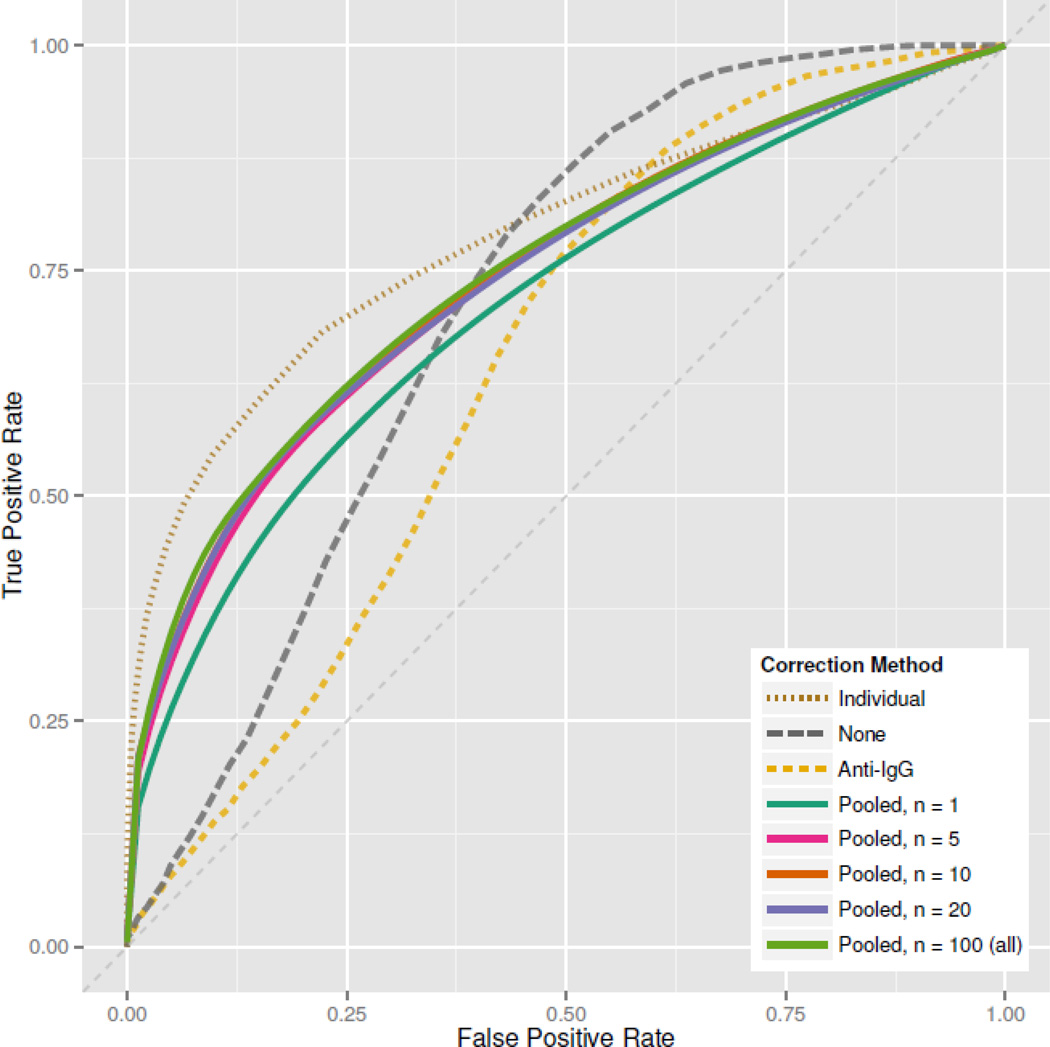
Figure 9. Correction Comparison.
ROCs based on different baseline correction methods, using Z-scale normalized peptide intensities in RV144a. “Pooled” methods are based on sampling n pre-treatment subjects and averaging their peptide responses as a single baseline control. For “pooled” methods, the displayed ROC is the average of 25 ROCs generated by randomly sampling n subjects. Individual specific baseline controls clearly outperform other methods, but we see that pooling baselines with n as small as 10 can produce reasonable results. Notably, a secondary antibody-only control performs poorly.

