Figure 1.

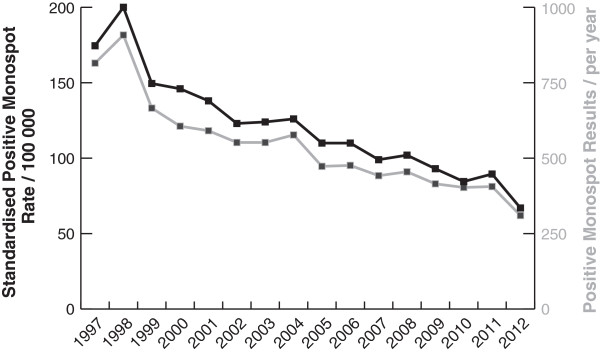
Positive Monospot tests from 1997 to 2012. Number of tests performed per year shown by grey line and right hand scale. Age-gender standardised rate shown by black line and left hand scale.

Positive Monospot tests from 1997 to 2012. Number of tests performed per year shown by grey line and right hand scale. Age-gender standardised rate shown by black line and left hand scale.