
Figure 4.
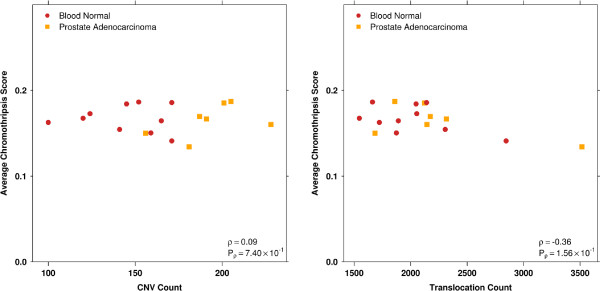
CNV and translocation count vs average chromothripsis score. These plots illustrates how a high total SV count does not necessarily produce high chromothripsis scores. Samples producing the highest chromothripsis scores had some of the lowest translocation and CNV counts, showing that ShatterProof scores are dominated by the clustering of SVs, not the absolute counts.