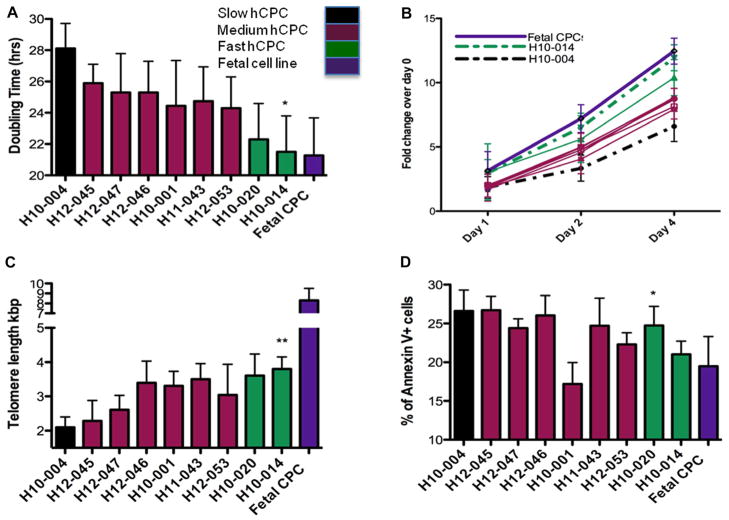
Figure 1. Characterization of human cardiac progenitor cell (hCPC) isolated from multiple patients.
A, hCPCs show variation in population doubling times as measured by CyQuant and viability assay cell counts from multiple patients (n=3). B, Differences in proliferation rates are observed in multiple hCPC lines (n=3). C, Telomere lengths in multiple hCPC lines show variability as measured by real-time polymerase chain reaction (n=6). D, Percentage of dead cells measured by Annexin-V staining showed variability in multiple hCPC lines when exposed to 30 μmol/L of H2O2 challenge (n=3). Black bar represents hCPC with slow-growth kinetics (hCPC-S), maroon bars represents hCPC with medium growth kinetics, green bars represents hCPC with fast-growth kinetics (hCPC-F), purple bar represent hCPC isolated from fetal heart samples (Fetal CPC). *P<0.05, **P<0.01. Significance values are calculated for hCPC-S versus hCPC-F groups.

