
Figure 2.
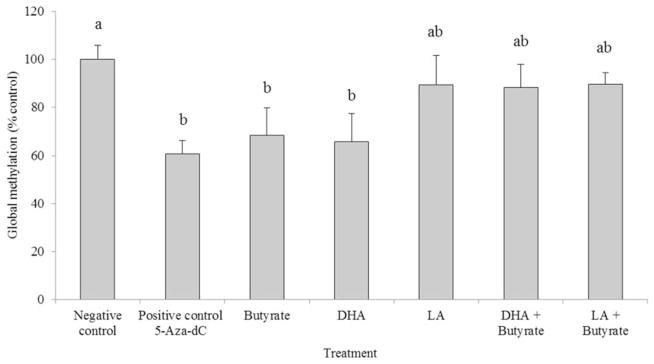
Global DNA methylation status (percent of the negative control) in HCT-116 cells cultured with 5-Aza-dC (48 h), butyrate (12 h), DHA (72 h), LA (72 h), or co-treatment (see “Experiment I” section for details of Experiment I). Values are means ± SEM. Values not sharing common letters are significantly different, P <0.05, n = 6 per treatment. Negative controls represent cells incubated in media only. DHA: docosahexaenoic acid; LA: linoleic acid