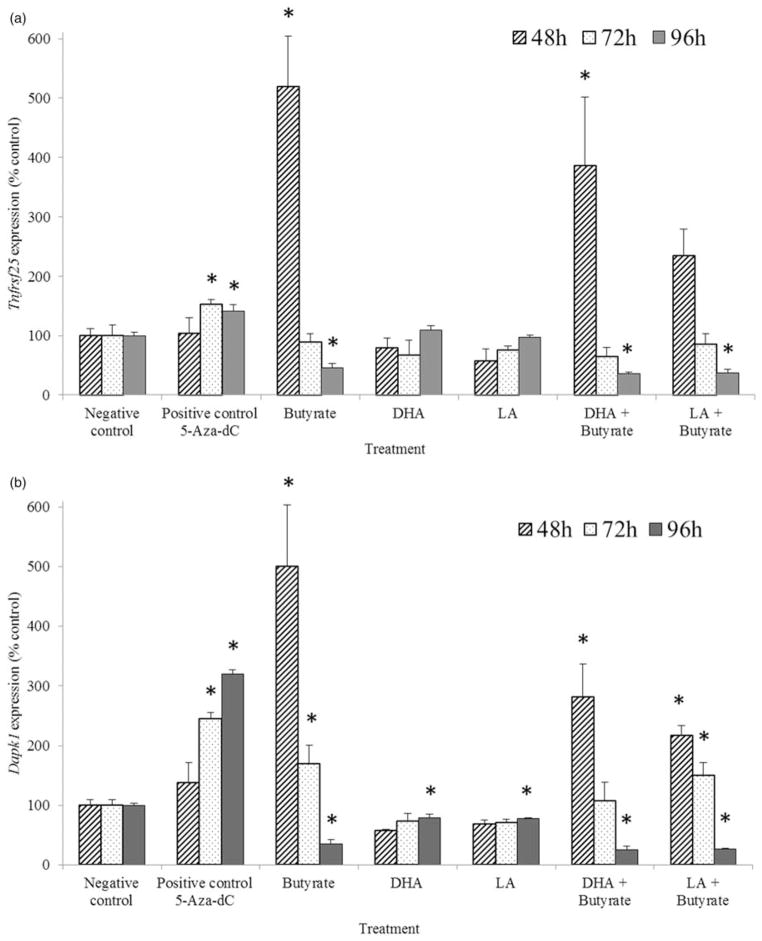
Figure 3.
Time-course analysis of Tnfrsf25 (Panel a) and Dapk1 (Panel b) transcript levels (expressed as percentage of the negative control) in HCT-116 cells cultured with 5-Aza-dC, butyrate, DHA, LA, or co-treatment for 48, 72, or 96 h (see “Experiment II” section for details of Experiment II). Values are means ± SEM. *Different from the negative control sample measured at the same time point, P <0.05, n = 3 per treatment. The negative controls were cells incubated in media only

