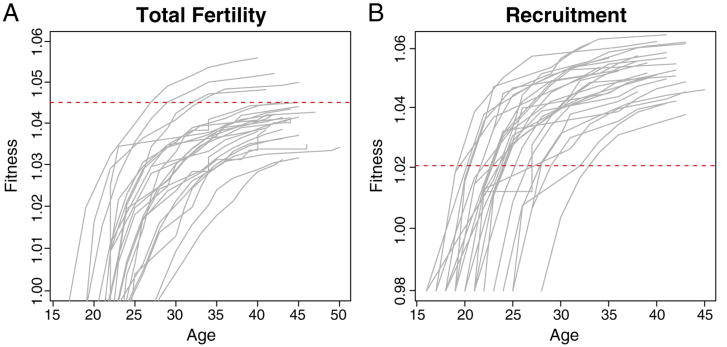
Fig. 2.
(A) Sample of 26 individual cumulative fitness curves by parity for women with total parity of 10 or greater. The plot shows strongly diminishing marginal fitness with parity. Mean fitness is λ̅) = 1.045. (B) Sample of 28 individual cumulative fitness curves by parity for women with recruitment parity of six or greater. The plot shows strongly diminishing marginal fitness with parity. Mean fitness is λ̅ = 1.021.

