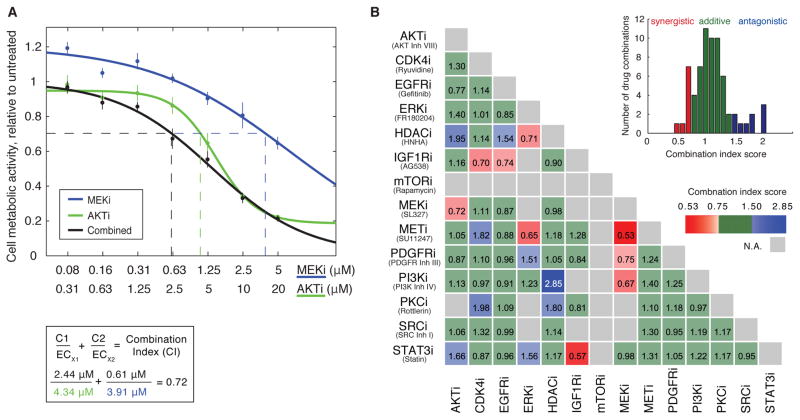
Figure 1.
Drug combination screen identifies synergistic and antagonistic drug targets in the dedifferentiated liposarcoma cell line, DDLS8817. (A) Example of CI score calculation of paired drug perturbation using the MEK inhibitor, SL327 (MEKi), and the AKT inhibitor, AKT inhibitor VIII (AKTi). Cell viability was estimated after 72 hours of drug treatment by the Resazurin assay that measures cellular metabolic activity. Error bars represent standard deviation of at least four biological replicates. (B) CI scores for a drug synergy screen performed in DDLS8817 cells using 14 targeted inhibitors (“Inh” or “i” in the labels). CI scores were derived as described in (A) and categorized as synergistic (<0.75, red), antagonistic (>1.5, blue), or additive (green). In some cases CI scores could not be calculated (gray). Inset shows distribution of CI scores. A complete list of targets and secondary targets of the drugs used are provided in table S1. Each CI score represents data from seven different drug doses of single and paired drug treatments with at least four biological replicates per condition.

