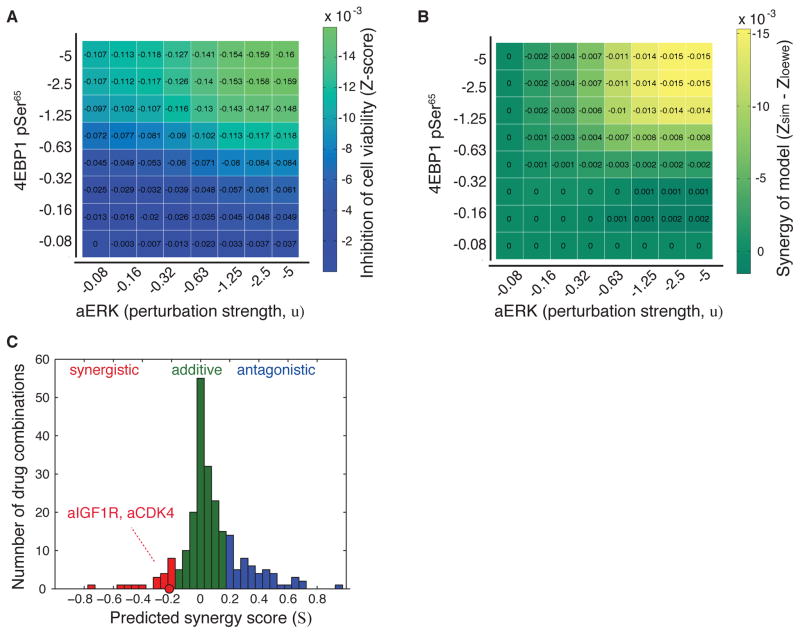
Figure 5.
Synergistic effects are captured in the network models, and the experimentally observed CDK4-IGF1R drug synergy is recapitulated. (A) Example of calculation of model-based synergy scores (S) by in silico perturbation of the 4EBP1_pSer65 (phospholyrated at Serine 65) and ERK encoded as an activity node (aERK, external drug node). These nodes were inhibited with eight different perturbation strengths (u) in all possible combinations and the effect was recorded as the response on the cell viability node (z-score). (B), Non-additive synergy effects (Synergy of model) were determined as the difference between the effect of the paired inhibition and the added effects of the two single node inhibitions (S=−0.24 for aERK and 4EBP1_pSer65). (C), Computed synergy scores for all node-pairs where each synergy scores was determined from 64 unique perturbations as in (A). Synergy scores were categorized into three classes, where S<−0.20 was considered synergistic (red), >0.20 antagonistic (blue), and otherwise additive (green). The synergy score for IGF1R and CDK4 node inhibition is highlighted (S=−0.23).

