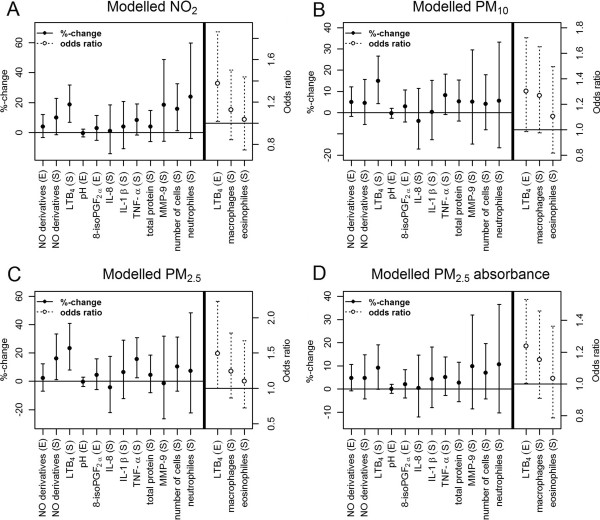
Figure 2.
Association of markers of inflammation with particles and NO2. Percentage changes and odds ratios with the corresponding 95% confidence intervals for inflammatory markers in exhaled breath condensate (E)* and in induced sputum (S)* for an increase by one interquartile range (IQR) of land-use regression modelled NO2(A), PM10 (B), PM2.5(C), PM2.5 absorbance (D), adjusted for age, smoking (current smoking, former smoking, never smoking), current passive smoking, indoor mould and socio-economic status by years of schooling. Number of women for each model: NO derivatives (E) =380, NO derivatives (S) =320, LTB4 (S) =320, pH (E) =377, 8-isoPGF2α (E) =360, IL-8 (S) =314, IL-1β (S) =316, TNF-α (S) =316, Total protein (S) =320, MMP-9 (S) =275, number of cells (S) =321, neutrophils (S) =317, LTB4 (E) =369, macrophages (S) =317, eosinophils (S) =317. *Due to place restriction in the figures we did not use the same abbreviations for exhaled breath condensate (EBC) and induced sputum (IS) as stated in the text.

