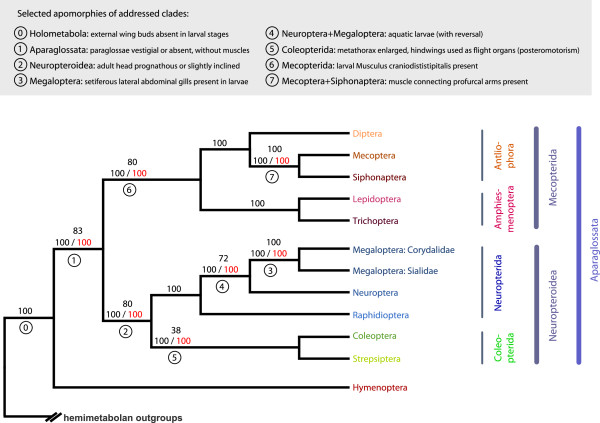
Figure 1.
Combined and simplified cladogramm of holometabolan insect relationships, with selected autapomorphies for the clades addressed in this study. The topology is taken from the ML tree inferred from dataset 1 (i.e., the complete datamatrix). (1) Bootstrap support (BS) (bottom, black) is derived from 72 bootstrap replicates (MRE-based bootstopping criterion) of dataset 1. (2) BS values for the specific phylogenetic relationship (bottom, red) are derived from ML tree inferences from the seven specific decisive datasets 1 to 7. (3) relative support [%] values for the specific phylogenetic relationship (top) are derived from the Four-cluster Likelihood Mapping (FcLM) with the seven specific decisive datasets. Apomorphies are selected from the full lists of reconstructed groundplan characters (see Additional file 4, Chapter 5).

