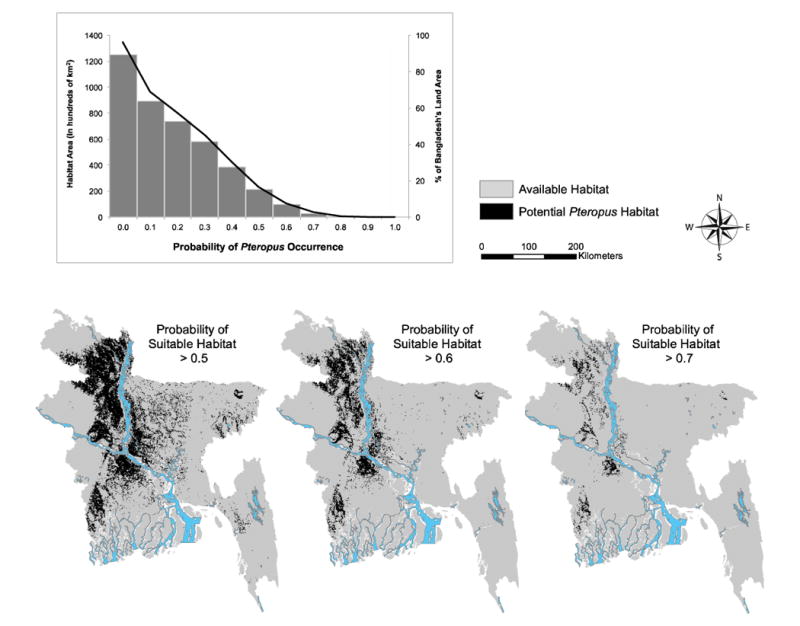
Fig. 3.

The graph shows the amount of habitat predicted as suitable at probability thresholds from 0–1.0 (bar graph) and the percent of Bangladesh's land area represented by these habitat areas (right vertical axis). The maps show areas of suitable habitat conditions for Pteropus giganteus in Bangladesh based on maximum entropy modelling results at increasingly strict probability thresholds. The most suitable conditions are shown in the threshold > 0.7 map (far right).
