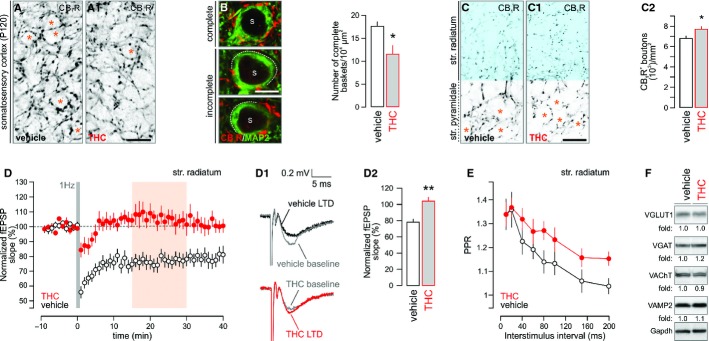
Figure 1. In utero Δ9-tetrahydrocannabinol (THC) exposure modifies synaptic connectivity and responsiveness in the cortical circuitry of adult offspring.

A, A1 Prenatal THC exposure significantly decreased the density of perisomatic CB1R+ boutons, presumed pre-synapses, within superficial cortical laminae receiving prominent CB1R+ innervation by P120 (* denotes the positioning of postsynaptic neurons in layer II/III).
B, B1 This deficit has precipitated the formation of fragmented perisomatic CB1R+ “baskets” (s denotes the location of neuronal somata).
C–C2 Similarly, THC exposure misrouted hippocampal CB1R+ afferents, significantly increasing their density in the CA1 stratum radiatum [blue in (C) and (C1)(* indicates the position of neuronal somata)]. Quantitative densitometry of CB1R+ boutons in the stratum radiatum is shown in (C2).
D–D2 Summary graphs of the time-course of field excitatory postsynaptic potentials (fEPSPs) from CA1 pyramidal cells showed impaired LTD induction upon low-frequency stimulation of Schaffer-collaterals (Dudek & Bear, 1993) in THC-exposed mice (n = 6–7 males/group; P120). Orange shading denotes data binned in (D2). Representative sample traces of experiments in vehicle or THC-exposed material recorded 15–30 min after LTD induction (D1). The degree of synaptic depression as revealed by binning data 15–30 min after LTD induction (D2).
E Paired-pulse facilitation revealed altered presynaptic neurotransmitter release upon prenatal THC exposure (n = 6 animals/group; P 120).
F Rewiring and reduced synaptic plasticity in the cortical circuitry were not associated with long-lasting modifications of synaptic protein expression in the hippocampus of offspring prenatally exposed to THC (P120). Fold changes were normalized to gapdh and expressed as percentages (n = 4/group; see Supplementary Fig S1B and C).
Data information: Data were expressed as means ± s.e.m.; ***P < 0.001, **P < 0.01, *P < 0.05. Scale bars, 20 μm (A1,C1) or 8 μm (B).
Source data are available online for this figure.
