
Figure 3. Δ9-tetrahydrocannabinol (THC) regulates SCG10 expression in the fetal cerebrum.
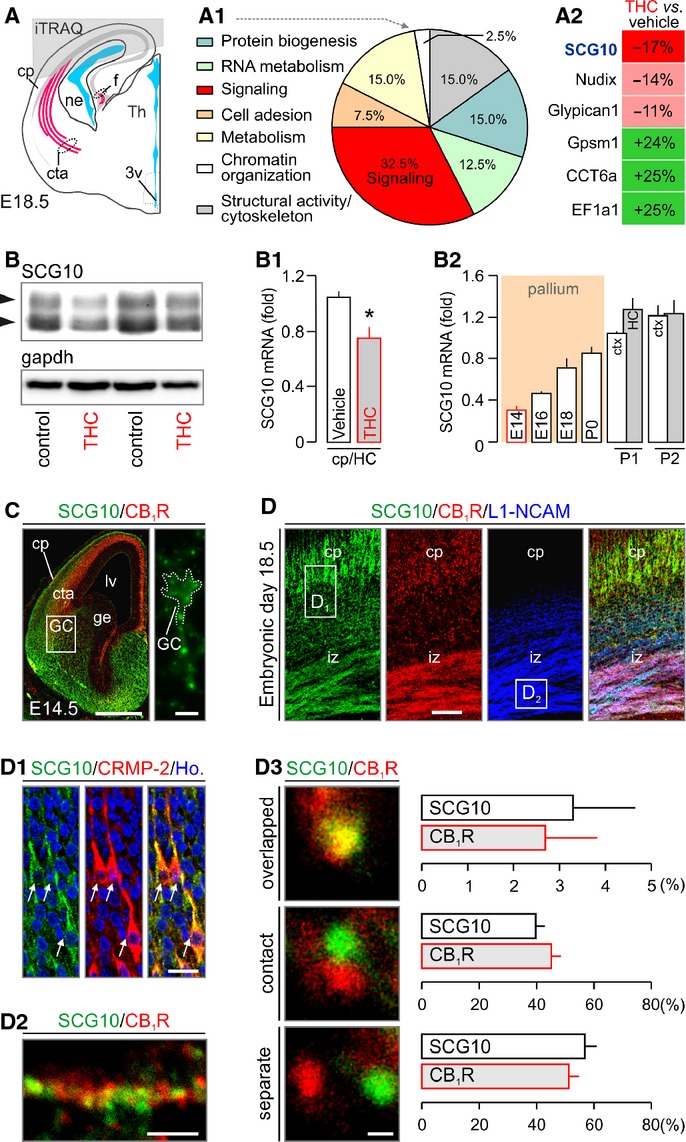
A–A2 Grey overlay indicates the origin of cortical tissues used for iTRAQ/mass spectrometry target discovery. Ontology classification of the 35 protein hits based on primary function assignments is shown in (A1). Topmost modified protein targets are listed in (A2). SCG10 was significantly down-regulated in THC-exposed fetuses (see also Supplementary Fig S3A).
B–B2 Reduced SCG10 protein (B) and mRNA levels (B1) in THC-exposed fetuses (E18.5) were verified by Western blotting and qPCR, respectively. Temporal profile of SCG10 mRNA expression during cortical development is shown in (B2). Grey bars identify the hippocampus (HC). SCG10 protein and mRNA levels were normalized to Gapdh (B, B1) or TATA-binding protein (B2), respectively.
C SCG10 protein is enriched in axonal pathways and accumulates in growth cone-like structures traversing the pallio-subpallial boundary by E14.5 (inset).
D–D3 SCG10 was found co-distributed with CB1Rs in pyramidal-like cells populating the cortical plate (cp) and corticofugal axons. Open rectangles denote the general localization of insets in (D1) and (D2). SCG10 co-existed with collapsing response mediator protein 2 (CRMP-2), a key mediator of appropriately targeted axonal extension (Goshima et al, 1995) in functional antagonism (Fukata et al, 2002) with SCG10 (D1). High-resolution confocal imaging revealed CB1Rs and SCG10 in close proximity in corticofugal axons (D2). Quantitative analysis of the physical proximity relationship of CB1Rs and SCG10 showed approximately 50% co-localization including overlapping and contacting signals (D3) (> 100 proximity relationships per axon in n > 25 axons/group from ≥ 3 animal/group were determined).
Data information: Data were expressed as means ± s.e.m.; *P < 0.05. Scale bars, 250 μm (C), 50 μm (D), 20 μm (D1), 5 μm (D2) or 1 μm (D3). For a list of abbreviations, see the Supplementary information.