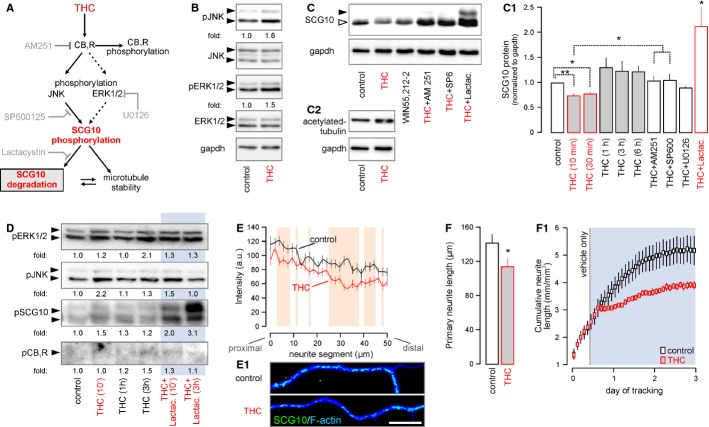
Figure 5. Δ9-tetrahydrocannabinol (THC)-induced phosphorylation drives SCG10 degradation.
A Schema of presumed signaling events and interactions. Grey color indicates the site of action for the various antagonists used in pharmacological experiments.
B THC stimulation (10 min) of cultured cortical neurons induced coordinated JNK and Erk1/2 phosphorylation. Fold changes were normalized to total (non-phosphorylated) JNK or ERK. Gapdh served as a loading control.
C–C2 THC and WIN55,212-2-induced SCG10 degradation is CB1R- and JNK-dependent, as shown in rescue experiments with co-applied AM 251 and SP600125. Moreover, lactacystin, an irreversible inhibitor of the 26S proteasome (Keimpema et al, 2010), prevented SCG10 loss, confirming its rapid proteasomal degradation downstream from CB1Rs. Increased tubulin acetylation in the same experiment suggests reduced SCG10 destabilizing activity, since acetylated tubulin accumulates in long-lived stable microtubules (C2) (Maruta et al, 1986).
D Time-resolved phosphoprotein profiling shows coincident Erk1/2, JNK and SCG10 phosphorylation after 10 min of THC exposure. Increased phospho-SCG10 levels persist up to 1 h after THC stimulation. Lactacystin (Keimpema et al, 2010) prevented phospho-SCG10 degradation. Note that CB1R phosphorylation is delayed until 3 h post-stimulation. Data were normalized to control.
E, E1 THC exposure (10 min) reduced SCG10 in neurite shafts. Quantitative fluorescence mapping of SCG10 in neurites (n = 35/condition). Representative images are shown in (E1).
F THC exposure for 24 h diminished neurite outgrowth (n ≥ 25 neurons/condition). Dynamic time-course analysis of neurite outgrowth using an IncuCyte automated imaging system (F1). Blue box indicates the period of THC application. Note the rapid growth arrest after introduction of the drug.
Data information: Data were expressed as means ± s.e.m. except for (E), which depicts the population mean. **P < 0.01 (including orange shading in E), *P < 0.05. Scale bar, 10 μm (E1).
Source data are available online for this figure.

