
Figure 3. hIF1-induced metabolic reprogramming and ROS signaling in cortical neurons.
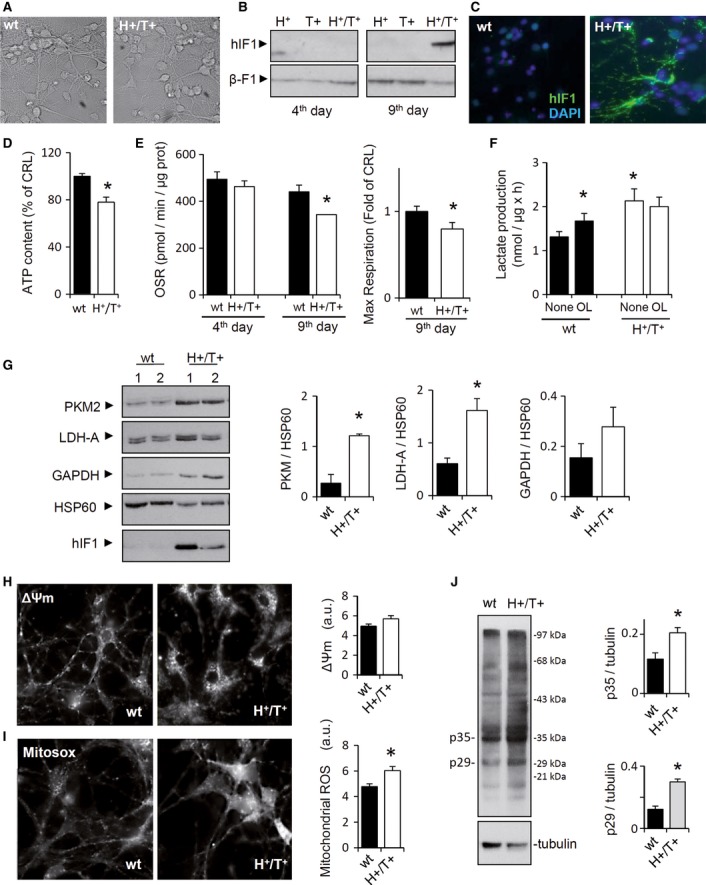
A–C In vivo phase-contrast images of 9-d cultures of cortical neurons obtained from control and H+/T+ embryos (A); magnification 40×. Representative Western blot (B) and immunocytochemistry (C) show the expression of hIF1 only in 9-d neurons of H+/T+ mice. β-F1-ATPase (β-F1) is used as a loading control. DAPI (4′,6-diamidino-2-phenylindole) staining is also shown. Magnification 40x.
D The cellular ATP content was determined in control (wt, closed bar) and H+/T+ (open bar) neuronal cultures.
E Shows the oligomycin-sensitive respiration (OSR) and maximal respiration in 4- and 9-day neuronal cultures from control (wt, closed bar) and H+/T+ (open bar) embryos.
F Rates of aerobic glycolysis (Lactate production) in the absence or presence of 5 μM oligomycin (OL).
G Representative Western blots of the expression of pyruvate kinase M2 (PKM2), lactate dehydrogenase A (LDH-A), glyceraldehyde-3-phosphate dehydrogenase (GAPDH), and heat-shock protein 60 (HSP60) in control (wt, closed bars) and hIF1-expressing (H+/T+, open bars) neurons.
H, I In vivo staining of TMRM+ (H, ΔΨm) or MitoSOX (I, ROS) charged mitochondria from 10-d primary cultures of cortical neurons. Magnification 40×.
J Representative experiment of carbonylation of proteins in primary neuronal cultures derived from control (wt) and H+/T+ mice. Tubulin is shown as a loading control. The migration of molecular mass markers is indicated to the right. Histograms show the quantification of p35 and p29 proteins.
Data information: The data shown are mean ± s.e.m. of three (D–F, H, and I) or four (G, J) cultures per condition. *P < 0.05 when compared to control by Student's t-test. See also Supplementary Figs S4, S5, and S6.
Source data are available online for this figure.