
Figure 1.
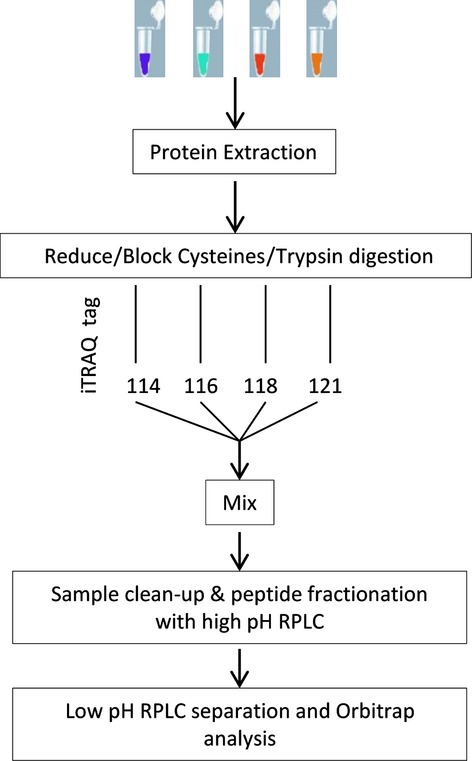
Proteomic process flow chart illustrating the steps involved in the differential analysis of TCs and FBs proteome in cell culture
Official websites use .gov
A
.gov website belongs to an official
government organization in the United States.
Secure .gov websites use HTTPS
A lock (
) or https:// means you've safely
connected to the .gov website. Share sensitive
information only on official, secure websites.
Proteomic process flow chart illustrating the steps involved in the differential analysis of TCs and FBs proteome in cell culture