
Figure 4.
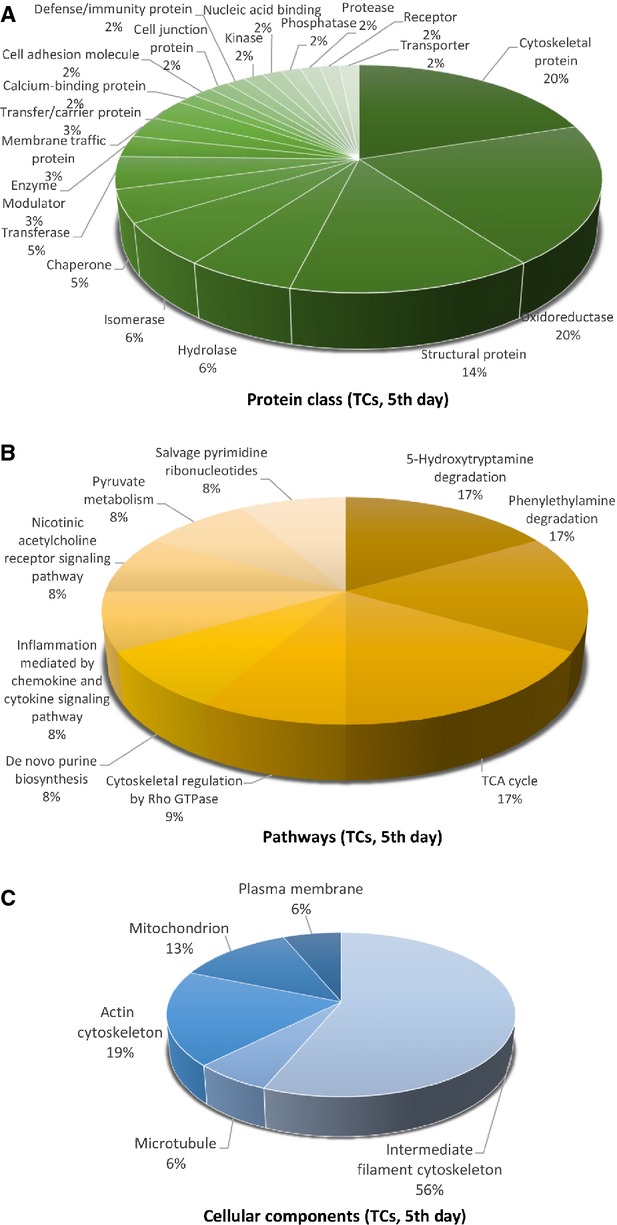
Pie chart representation of the distribution of identified proteins in TCs (cell culture, 5th day) according to their protein class (A), pathways (B) and cellular components (C) classifications.
Official websites use .gov
A
.gov website belongs to an official
government organization in the United States.
Secure .gov websites use HTTPS
A lock (
) or https:// means you've safely
connected to the .gov website. Share sensitive
information only on official, secure websites.
Pie chart representation of the distribution of identified proteins in TCs (cell culture, 5th day) according to their protein class (A), pathways (B) and cellular components (C) classifications.