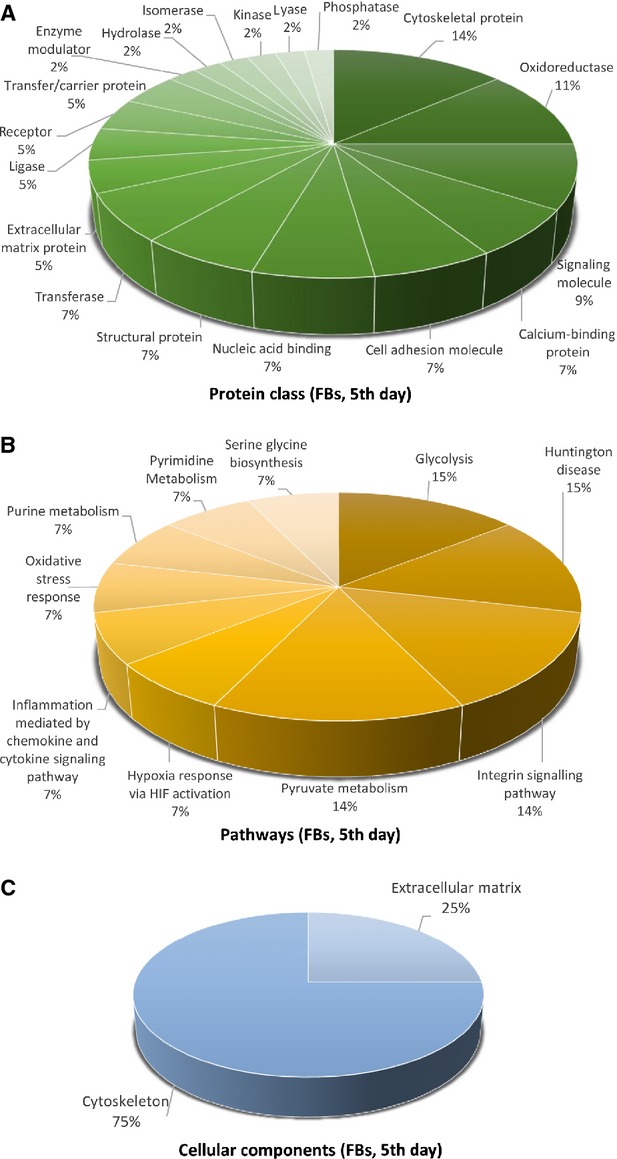
Figure 7.

Pie chart representation of the distribution of identified proteins in FBs (cell culture, 5th day) according to their protein class (A), pathways (B) and cellular components (C) classifications.

Pie chart representation of the distribution of identified proteins in FBs (cell culture, 5th day) according to their protein class (A), pathways (B) and cellular components (C) classifications.