
Figure 8.
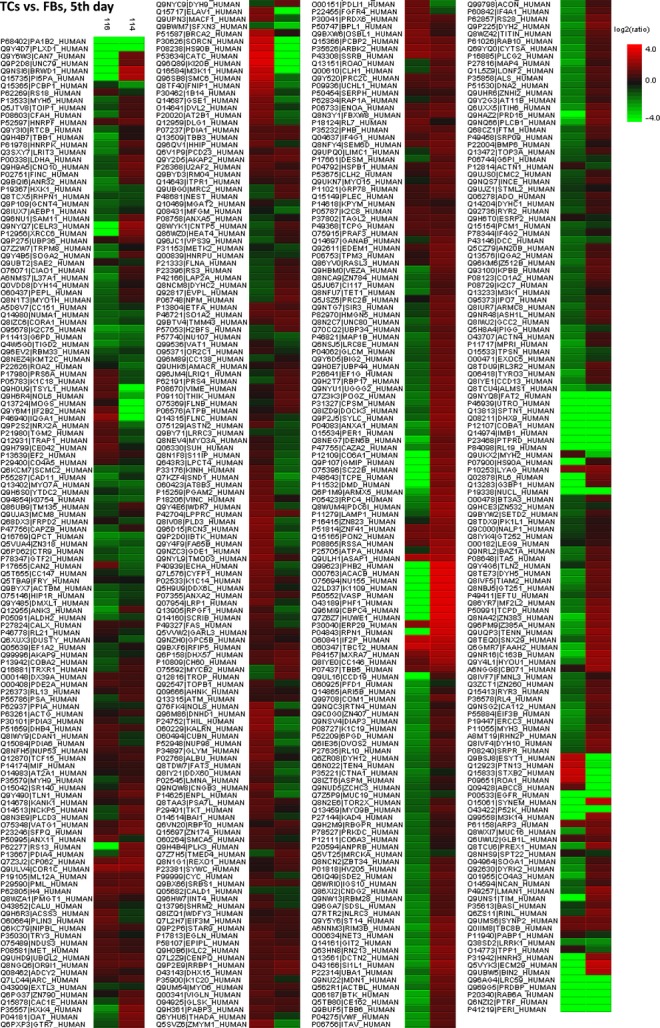
Heat map depicting significance results between TCs and FBs (cell culture, 5th day). Experimental samples are clustered on the horizontal axis and protein spots on the vertical axis. Red indicates increased and green decreased expression ratio, while black squares indicate no change in protein abundance. The colour gradient indicates the magnitude of fold change.