
Figure 12.
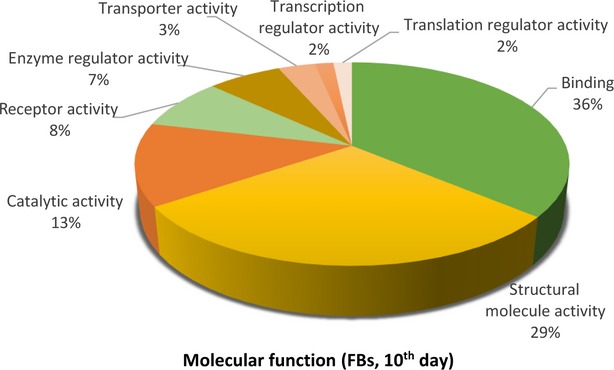
Pie chart representation of the distribution of identified proteins in FBs (cell culture, 10th day) according to their molecular functions. Categorizations were based on information provided by the online resource PANTHER classification system.