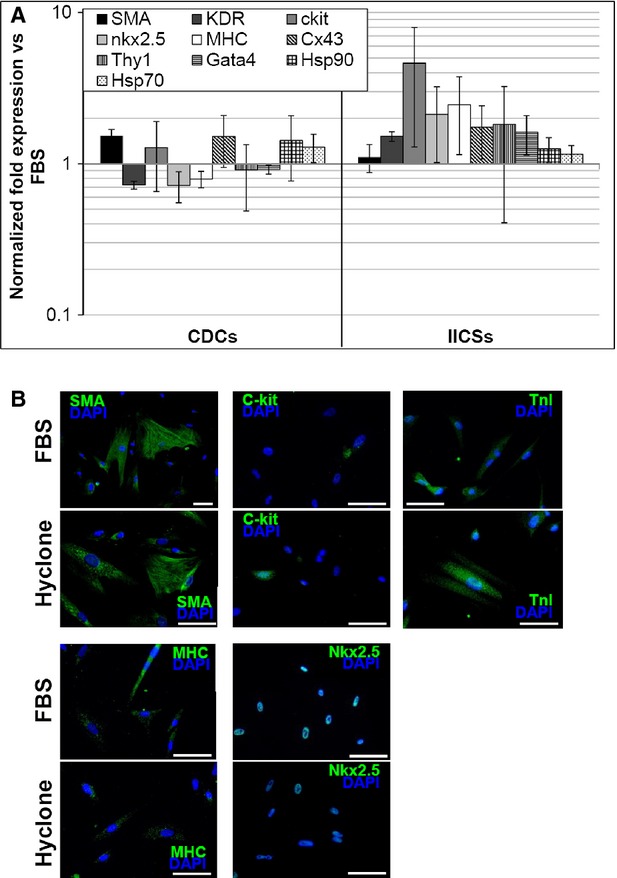
Figure 6.

Gene expression profile of cardiac progenitor cells cultured with Hyclone giFBS. Realtime PCR analysis (A) detected expression levels very similar to control for the genes analysed in Hyclone giFBS cultures, with a trend towards up-regulation in IICSs for some markers, such as c-kit. (B) Representative immunofluorescence panels for SMA, c-kit, TnI, MHC and nkx2.5, showing similar abundance and antigen distribution in Hyclons giFBS compared to standard conditions. Scale bars = 20 μm.
