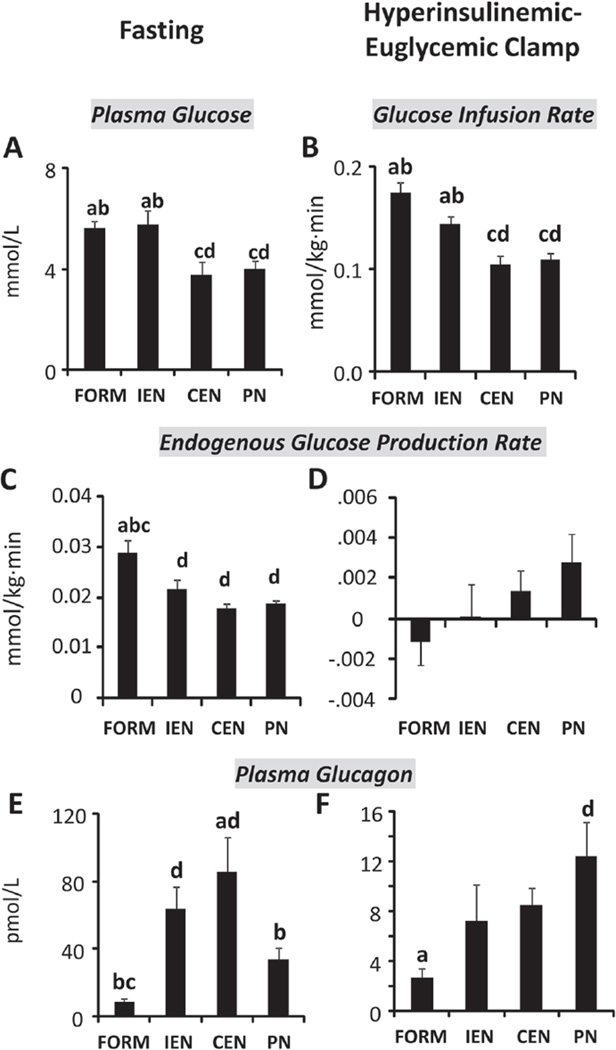
Figure 2.
Hyperinsulinemic-euglycemic clamp (CLAMP). Glucose, insulin, and glucagon during 6-hour infusion of D[13C6] glucose (0.005 mmol/kg·min) during fasting (0–2 hours) and CLAMP (3–6 hours) with insulin infusion of 31 pmol/kg0.66·min. Plasma glucose during fasting (A), glucose infusion rates during CLAMP (B), endogenous glucose production and plasma glucagon during fasting (C, E), and CLAMP (D, F). Plasma insulin (pmol/L) between groups was not different during fasting (12 ± 1), n = 54, or CLAMP (378 ± 12), n = 32. Results are expressed as mean ± SEM; n = 6–20 per group; abcd different from PN, CEN, IEN, and FORM, respectively; P < .05. CEN, continuous enteral nutrition; FORM, intermittent formula feeding; IEN, intermittent enteral nutrition; PN, parenteral nutrition.

