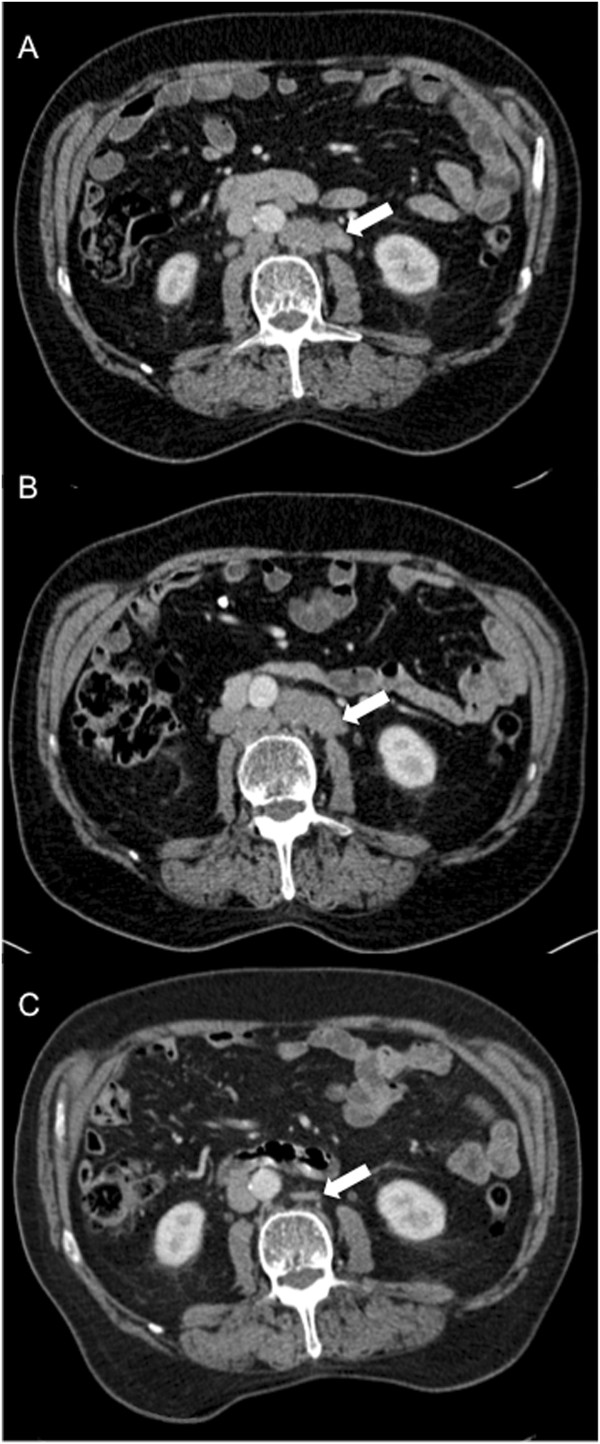
Figure 2.
Serial abdominal computed tomography scans. (A) Baseline computed tomography scan performed 3 days prior to the start of chemotherapy. Bulky retroperitoneal lymph nodes are visible (arrow). (B) End-of-treatment computed tomography scan performed 28 days following the last dose of chemotherapy. The lymphadenopathy persists (arrow) and was deemed stable by Response Evaluation Criteria In Solid Tumours criteria. (C) Follow-up computed tomography scan, performed 203 days following the last dose of chemotherapy. This scan was requested in view of the dramatic fall in PSA. Complete resolution of the lymphadenopathy is observed, with only a small residuum left (arrow).

