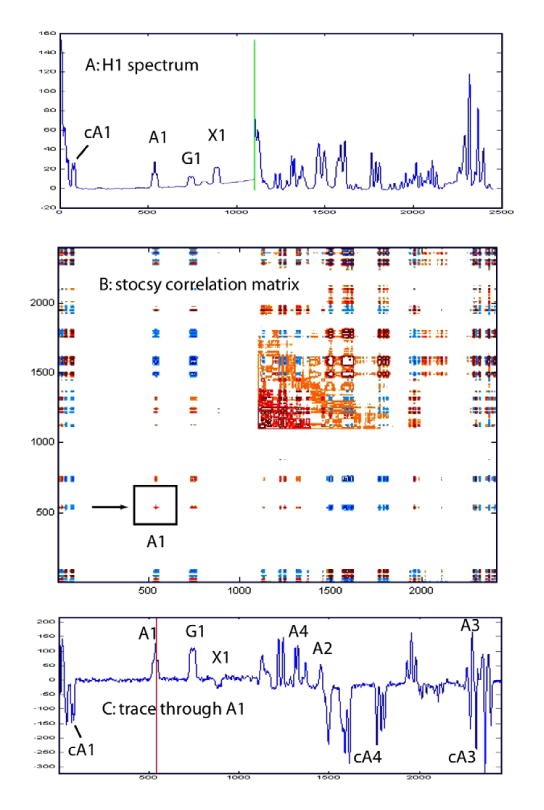
Figure 6.

Covariance matrix representation (STOCSY) of the spectra shown in Figure 4A corresponding to the time interval from 90 to 490 min. During this period, the UDP-apiose converts to apiofuranosyl-1,2-cyclic phosphate. Top spectrum A shows the corresponding regions from a 1D spectrum of the reaction mixture. Bottom spectrum C shows the peaks that are correlated to UDP-apiose resonance A1, indicated by box in panel C. See text for further discussion.
