
Figure 1.
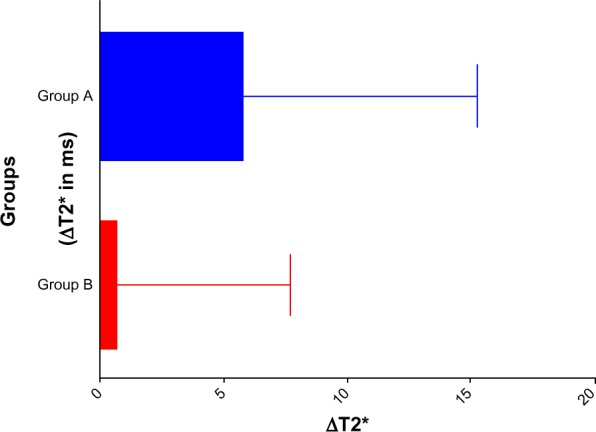
Graph showing ΔT2* (difference between the T2* value of the tumor and adjacent parenchyma) in group A and B.
Note: Whiskers represent standard error of the mean.
Official websites use .gov
A
.gov website belongs to an official
government organization in the United States.
Secure .gov websites use HTTPS
A lock (
) or https:// means you've safely
connected to the .gov website. Share sensitive
information only on official, secure websites.
Graph showing ΔT2* (difference between the T2* value of the tumor and adjacent parenchyma) in group A and B.
Note: Whiskers represent standard error of the mean.