
Figure 3.
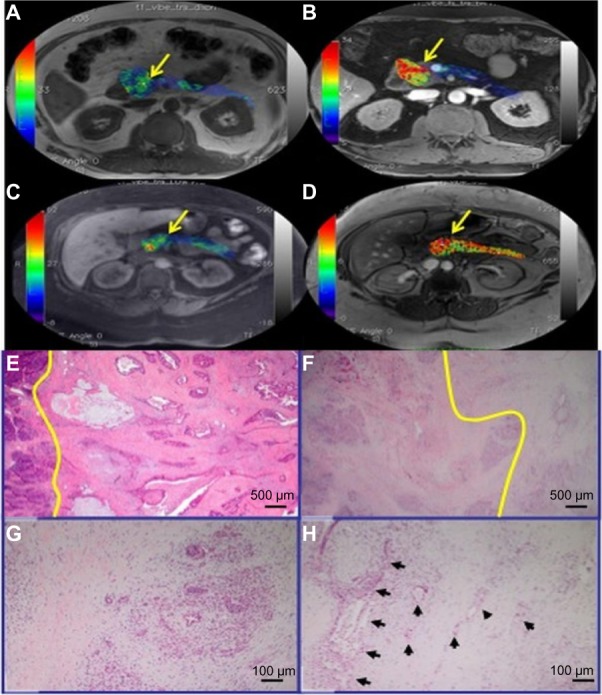
Pseudofused images of T2* maps over T1-VIBE pre- and post-ferumoxytol (A) and (B) showing distinct tumor margin (arrow) in a 55-year-old man who underwent neoadjuvant therapy. Pseudofused images of T2* maps over T1-VIBE pre- and post-ferumoxytol (C and D) showing less distinct tumor margin (arrow) in a 62-year-old man who did not undergo neoadjuvant therapy. (E) non-neoadjuvant; (F–H) neoadjuvant cases: yellow lines indicate a boundary between non-neoplastic parenchyma (left) and the tumor; (G) atrophic acini in the background of dense fibrosis; (H) several malignant glands (arrows) with therapeutic effects are seen in a patchy distribution in the background of dense fibrosis. Of note, the rim of the fibrotic non-neoplastic parenchyma is well demarcated from the intact pancreatic tissue at its periphery.
Notes: (E) and (F) at 20× magnification; (G–H) at 100× magnification.