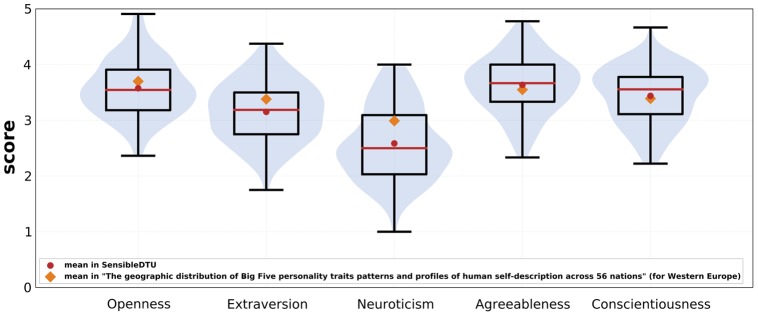
Figure 14. Personality traits.

Violin plot of personality traits. Summary statistics are: openness
 ,
,  ; extraversion
 ,
,  ; neuroticism

 ; agreeablenes

 ; conscientiousness

 . Mean values from our deployment (red circles) compared with mean values reported for Western Europe (mixed student and general population) [170] (orange diamonds).
