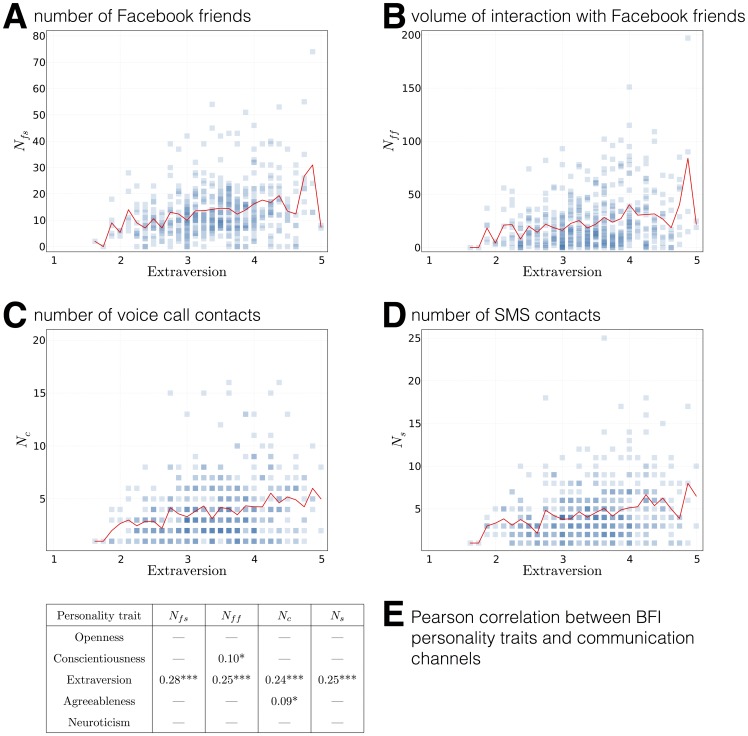
Figure 15. Correlation between personality traits and communication.
Data from the 2013 deployment for N = 488 participants, showing communication only with other study participants. Extraversion, the only significant feature across all networks is plotted. The red line indicates mean value within personality trait. Random spikes are due to small number of participants with extreme values. E) Pearson correlation between Big Five Inventory personality traits and number of Facebook friends  , volume of interactions with these friends
  , number of friends contacted via voice calls
  and via SMS
  . *:
. *:  , **:
, **:  , ***:
  .
.

