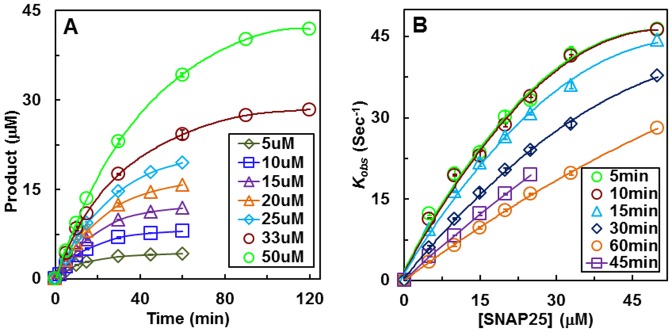
Figure 5. Time course of LcA reaction using various concentrations of SNAP25 (A), and linear plots of reaction rate (kobs) calculated at various time points versus SNAP25 concentrations (B).

Each reaction mixture contained 0.2/ml BSA, 5 mM DTT, and 250 µM ZnCl2, 0.34 nM LcA, and 50 mM Na-HEPES, pH 7.4. The bars inside symbols represent standard deviation of three assays. The lines connecting the data points in B were generated by curve fitting using the Michaelis-Menten equation kobs = (kcat×[S])/(Km+[S]) in a KaleidaGraph software package. Km and kcat values derived from these curves are reported in Table 2.
