
Fig. 6.
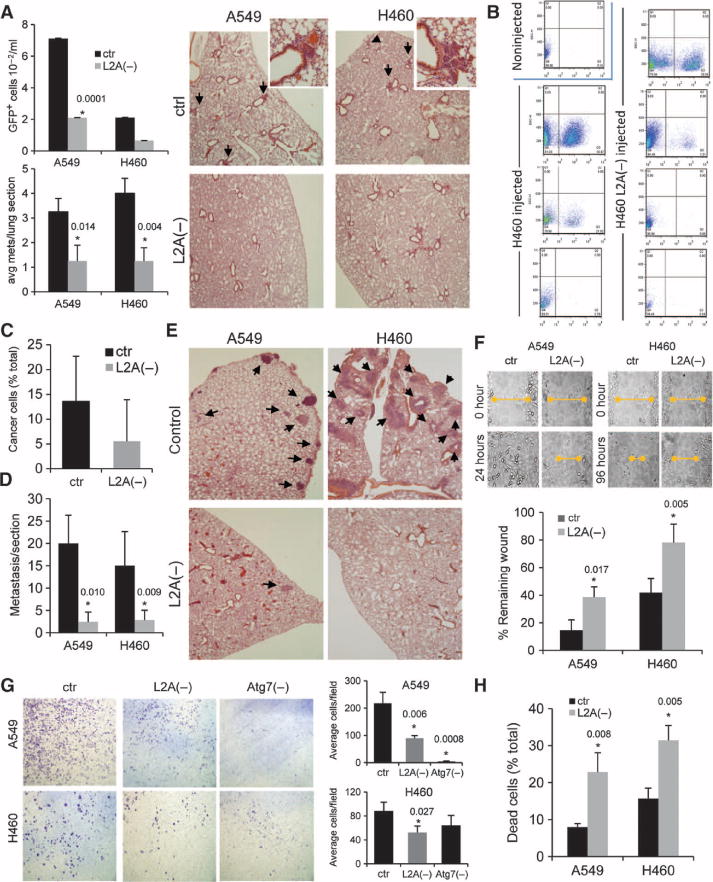
Inhibition of CMA reduces formation of human lung tumor metastases. (A) Nude mice were injected in the foot fat pad with A549 and H460 cells, either control or after LAMP-2A knockdown [L2A(−)]. The number of human cancer cells (detected by FACS analysis as GFP fluorescent cells) (top left) and the average number of metastases per lung section (bottom left) was quantified (n = 5 to 6 mice; *P = 0.0001, 0.014, and 0.004, t test). Right: representative H&E-stained sections of lungs. Arrows indicate cancer cell foci. (B to D) Nude mice were injected via the tail vein with H460 human lung cancer cells, either control or with LAMP-2A knocked down, and the lungs were subjected to treatment with collagenase to promote cell dissociation. The number of human cancer cells (detected as GFP fluorescent cells) was determined by FACS. Representative sorting plots of lungs from three to four different mice injected or uninjected with the different cell types (B) and mean values of the percentage of cancer cells in the total amount of cells sorted (C) (n = 3 to 5 animals). (D) Quantification of the number of lung metastases per mouse in sections (n = 3 to 5 mice; *P = 0.010 and 0.009, t test). (E) H&E-stained sections of the lungs from the same animals. Arrows mark areas of metastatic lesions. (F) Time course of wound closing in human lung cancer cells, either control or with LAMP-2A knocked down. Top: representative images of the size of the wound at different times. Bottom: quantification of the size of the wound at 24 hours. Values are expressed as percentage of the initial wound remaining (n = 3 to 4; *P = 0.017 to 0.005, t test). (G) Migration of human lung cancer cells, either control or with LAMP-2A and Atg7 knocked down, in the Transwell migration assay. Left: representative images of cells detected on the bottom side of the filter. Right: quantification of the number of cells detected per field (n = 3; *P = 0.006, 0.0008, and 0.027, t test). (H) Percentage of dead cells detected after preventing attachment of control and L2A(−) human lung cancer cells. Values are expressed as percentage of cells seeded (n = 3; *P = 0.008 to 0.005, t test).