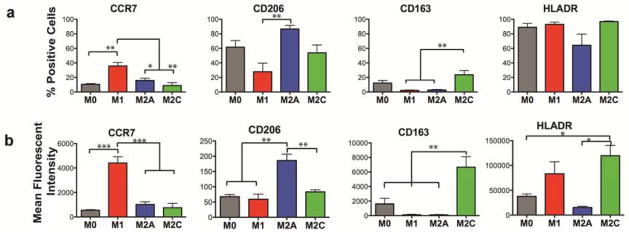
Figure 2. Flow cytometric analysis of macrophage phenotype markers.

(a) The percentage of cells staining positively for the surface marker, and (b) mean fluorescent intensity per cell (n = 3–5 human donors). Data are shown as Mean ± SEM. *p<0.05, **p<0.01, ***p<0.001.
