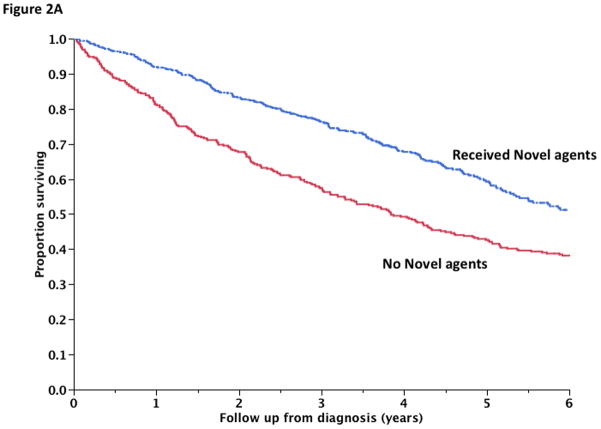
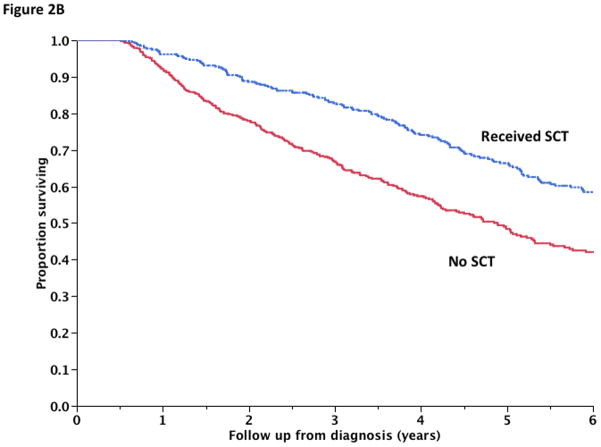
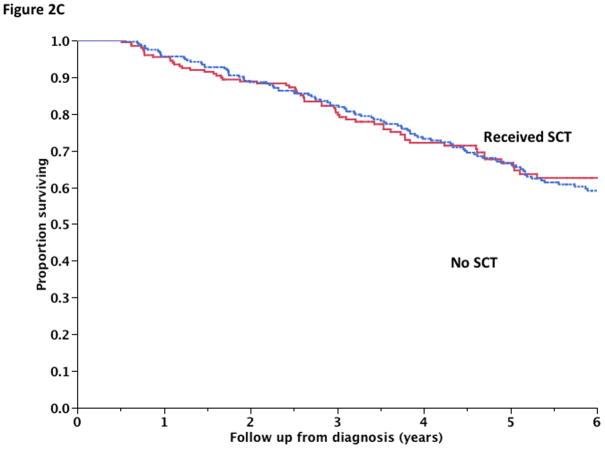
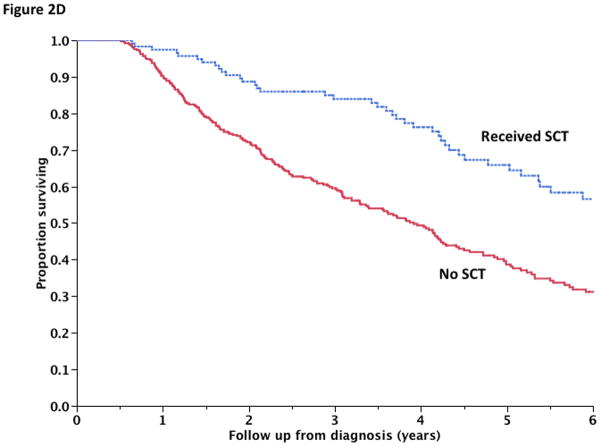
Figure 2.
Panel A shows the overall survival comparison between patients receiving one of the newer drugs (thalidomide, lenalidomide or bortezomib) as part of initial therapy and patients not receiving one of these regimens. Panel B shows the survival comparison between patients receiving an autologous stem cell transplantation versus those did not; with land marking at 6 months. Panels C and D demonstrates the survival comparison between patients receiving a stem cell transplant versus those who have not received a stem cell transplant among those 65 years or younger (Panel C) and those over 65 years (Panel D). Panel E shows the increasing risk of early mortality (1 year mortality) with increasing number of risk factors (identified age >70, serum albumin < 3.5 gm/dL, and serum beta 2 microglobulin > 6.5 mg/dL)


