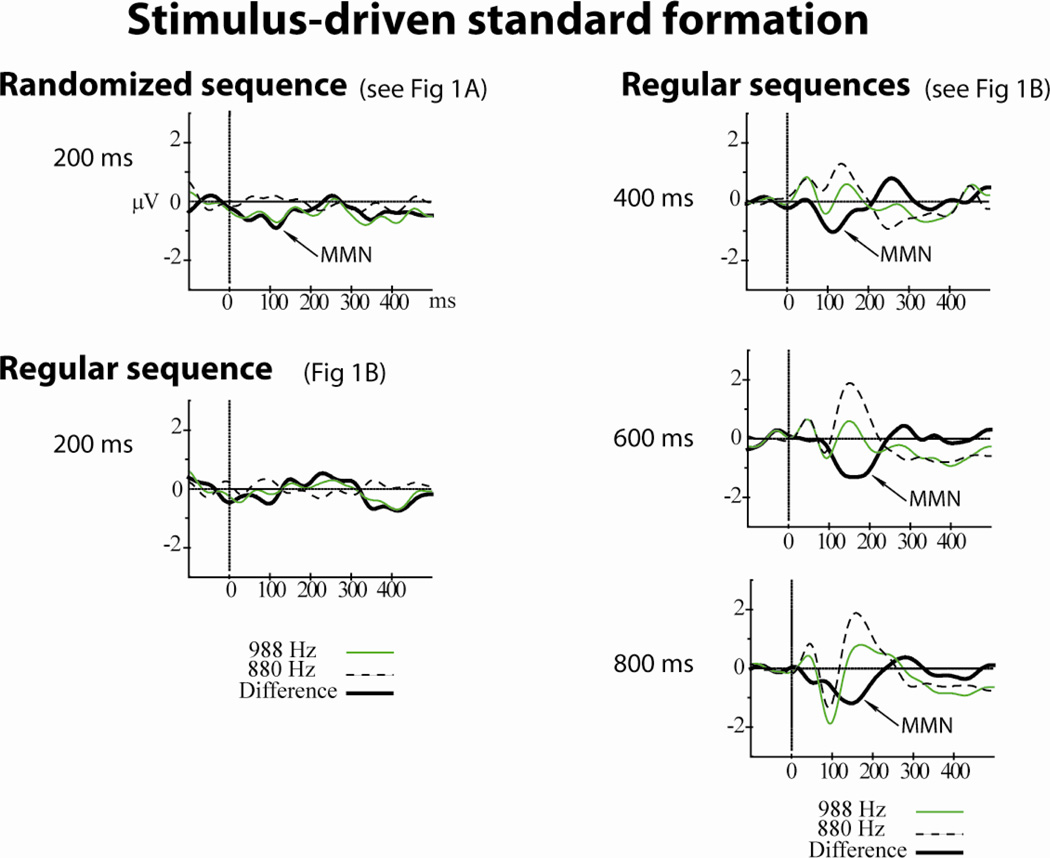
Figure 2. Stimulus-driven standard formation.
A fixed pattern of two tones (880 Hz and 988 Hz) was presented (see Fig 1B) in four conditions of stimulus rate (one tone occurring every 200, 400 ms, 600 ms, or 800 ms). ERPs to the 880 Hz tone are displayed with a dashed black line. ERPs to the 988 Hz tone are displayed with a green solid line, and the difference waveform (988 Hz-880 Hz) is displayed with a solid black line. Significant mismatch negativity (MMN) components are labeled and denoted with an arrow. Amplitude is depicted in microvolts along the y-axis, and timing is depicted in milliseconds along the x-axis. At relatively slow presentation rates (right column, 400–800 ms conditions), the MMN was elicited by the 988 Hz tones. Only at the fastest pace of the Regular sequences was there no MMN elicited by the 988 Hz tones (200 ms, left column, bottom row). The 200 ms Randomized sequence (left column, top row) shows that with the same ratio of tones as in the Regular sequence (1/5), MMN was elicited by the 988 Hz tones when the two tones were presented randomly, when there was no pattern in the sequence. Thus, the stimulus presentation rate influenced standard formation, which in turn modulated MMN elicitation. Figure adapted from Sussman & Gumenyuk (2005).

