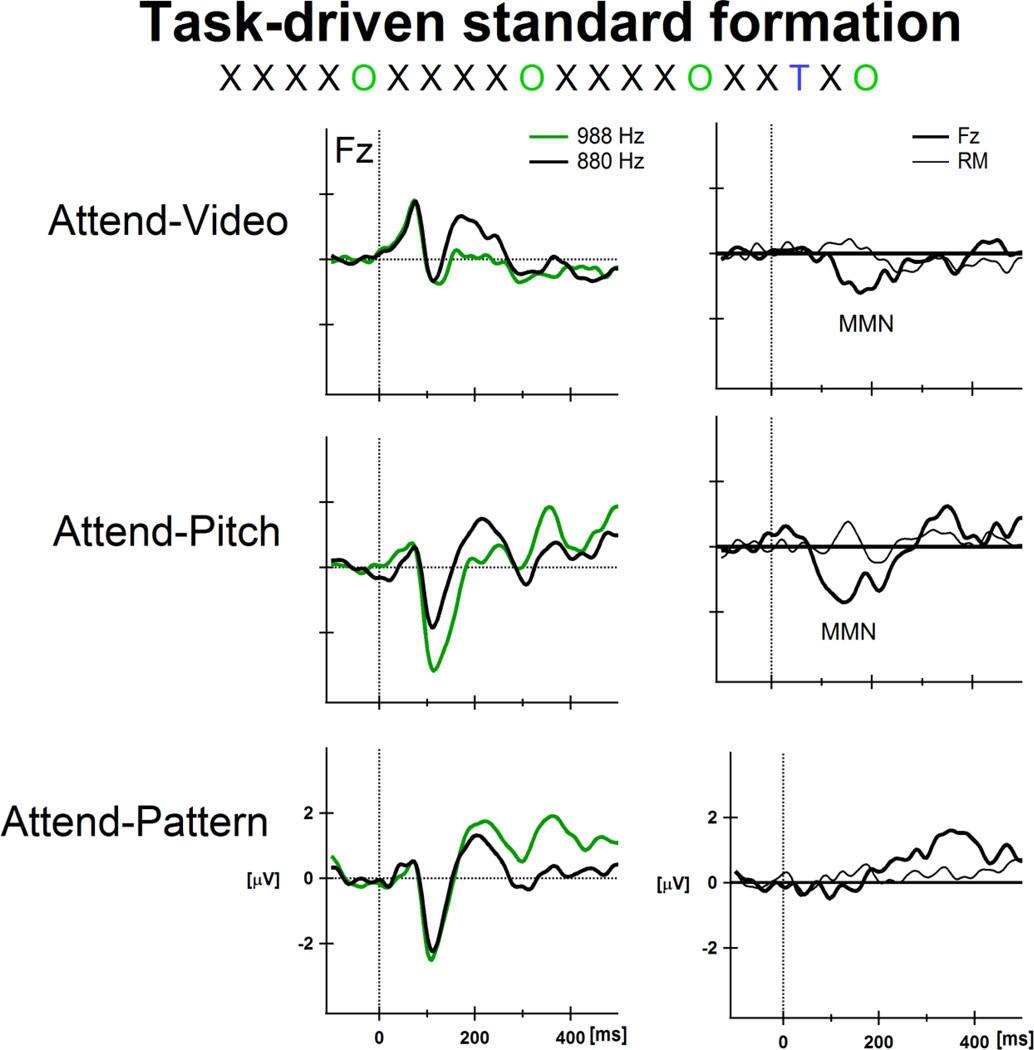
Figure 3. Task-driven standard formation.
Two tones were presented in a fixed order. The black ‘X’ represents the 880 Hz tone and the green ‘O’ represents the 988 Hz tone. The fixed order of presentation was a repeating five-tone pattern ( ). A lower frequency tone (784 Hz, designated by a blue ‘
  ’) occurred rarely (∼2%) and randomly within the sequence. The patterned sequence was presented in three conditions: Attend-Video (top row), Attend-Pitch (middle row), and Attend-Pattern (bottom row; see text for description of tasks). The
  tone was the target, which required a button press in both of the active conditions. The fifth tone of the pattern (988 Hz) was the ‘probe’ tone, and was never the target. Event-related potential (ERPs) responses to the 880 Hz tone (black trace) and to the 988 Hz tone (green trace) are displayed in the left column, at the Fz electrode. The x-axis displays time in milliseconds and the y-axis displays amplitude in microvolts. Difference waveforms (ERPs to the 988 Hz-minus-ERPs to the 880 Hz) are displayed in the right column, showing the Fz electrode (thick black line) with the right mastoid (RM) overlain (thin black line). The mismatch negativity (MMN) component is labeled in the difference waveforms. The probe tones (988 Hz) elicited MMN in the Attend-Video and Attend-Pitch conditions, and not in the Attend-Pattern condition. The results show effects of task-specific standard formation because only the instruction of how to attend to the tones differed across conditions (see text for fuller explanation). ERP responses to the target (
 ) tones are not displayed (MMNs were elicited by the ‘
  ’ tones in all conditions). Figure adapted from Sussman et al., 2002.

