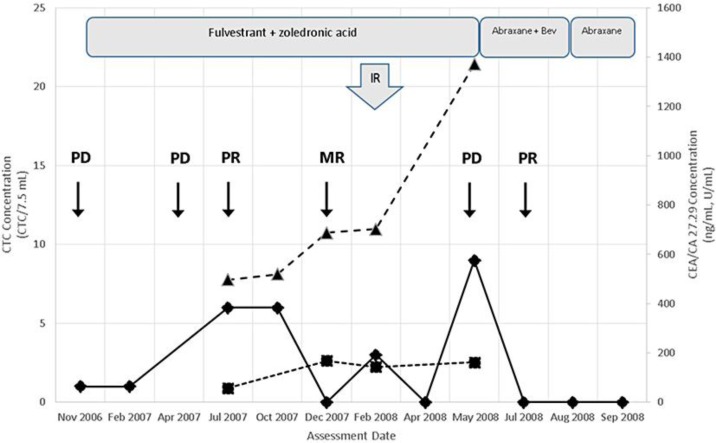
Fig. 1.
Integrated display of therapy and assessments performed. The various assessments used in managing this case are displayed. Each symbol represents an assessment: ▴ = CTC count; ▴ = CA 27.29 determination; ▪ = CEA determinations. The time point of each PET/CT imaging assessment is shown as a two-letter code with an arrow below: PD = progressive disease; PR = partial response; MR = mixed response. Boxes representing the duration of each treatment are shown across the top of the graph with the name of the therapeutic regimen. The arrow labeled IR indicates the time frame when radiation treatment was given. Bev = Bevacizumab.

