
Figure 1.
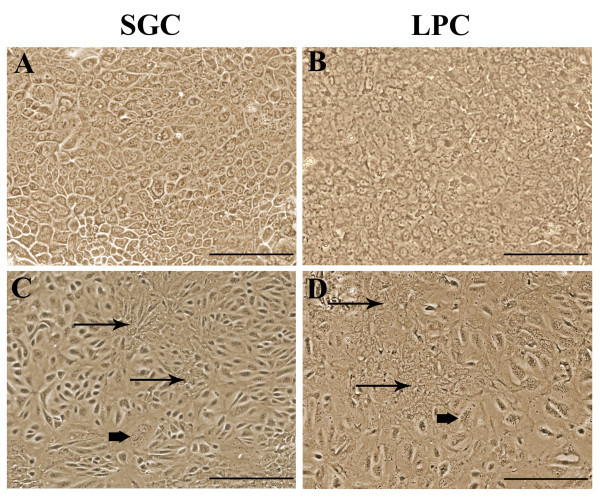
The morphology of mouse salivary gland and liver progenitor cells (phase contrast microscopy; scale bars = 100 μm): (A) SGC monolayer, primary culture; (B) LPC monolayer, primary culture; (C) SGC monolayer, passage 1; (D) LPC monolayer, passage 1. Cell heterogeneity is manifested in passage 1 monolayers (C, D), where groups of small actively proliferating cells (thin arrows) and large multinuclear cells (thick arrows) can be seen.