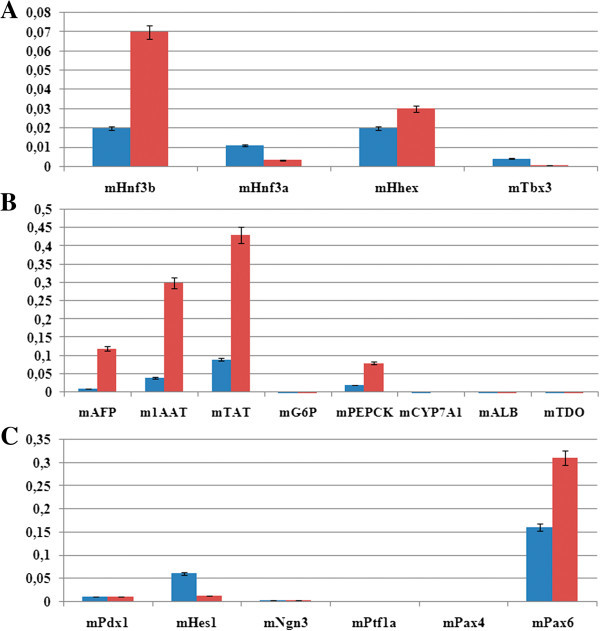
Figure 4.

Quantitative RT-PCR analysis of first-passage salivary gland and liver progenitor cells for mRNAs of different cell markers (relative to GAPDH mRNA expression level taken as 1). Blue and red bars refer to SGC and LPC, respectively. (A) Liver-enriched transcription factors; (B) liver-specific cell differentiation markers; (C) pancreas-enriched transcription factors.
