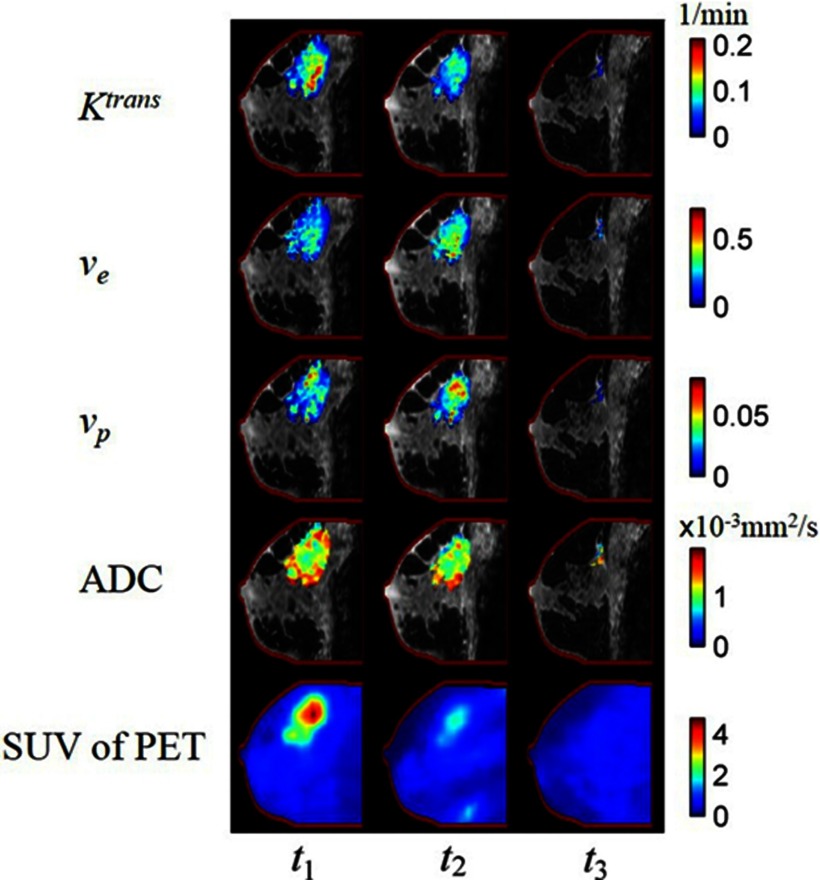
Figure 2.
Parametric maps overlain on THRIVE anatomical scans. The columns correspond to the images obtained at t1, t2, and t3, respectively. Five rows correspond to Ktrans, ve, vp, ADC, and SUV. The contour of the THRIVE at t3 is copied to the other images in order to facilitate comparison of the registration result. Note the variations in intratumoral spatial distributions of the various parameters. By performing longitudinal, intermodality registrations, such comparisons at the voxel level are now possible.

