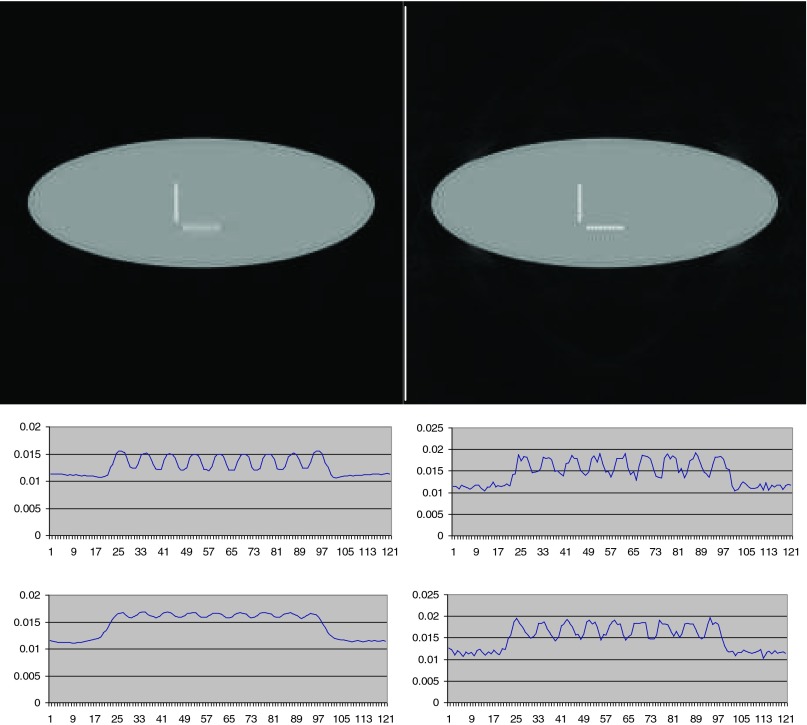
Figure 4.
Images reconstructed by iterative weighted Landweber algorithm using noiseless computer simulated data. (First column) 500 iterations. (Second column) 5000 iterations. (First row) Display with a full gray-scale from minimum to maximum for each image. (Second row) Line profiles along the horizontal small dots. (Third row) Line profiles along the vertical small dots.

